The 19th-Century Charts That Put the World’s Waterfalls on One Impossible Landscape
Imagine the roar.
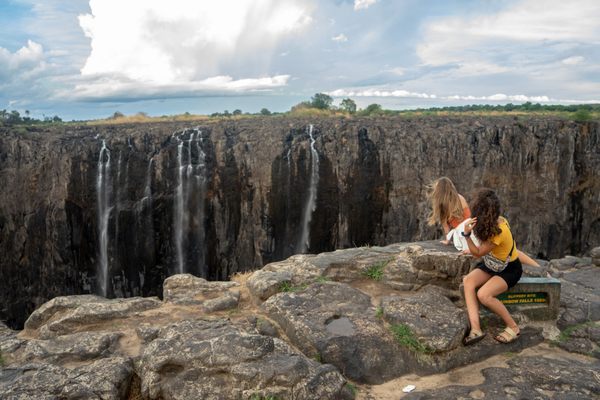
If you’ve been to a big waterfall, then you know the experience of standing close to one varies greatly. On a sweltering day, the spray feels like a free sprinkler, gentle and invigorating. On a cooler, windier one, it’s more like an unwelcome, soaking rain. (Little wonder that the boats that have ferried visitors past Niagara Falls since 1846 supply hooded ponchos.) The sound of the tumbling water changes, too, from a pleasant muffling to a rib-rattling roar.
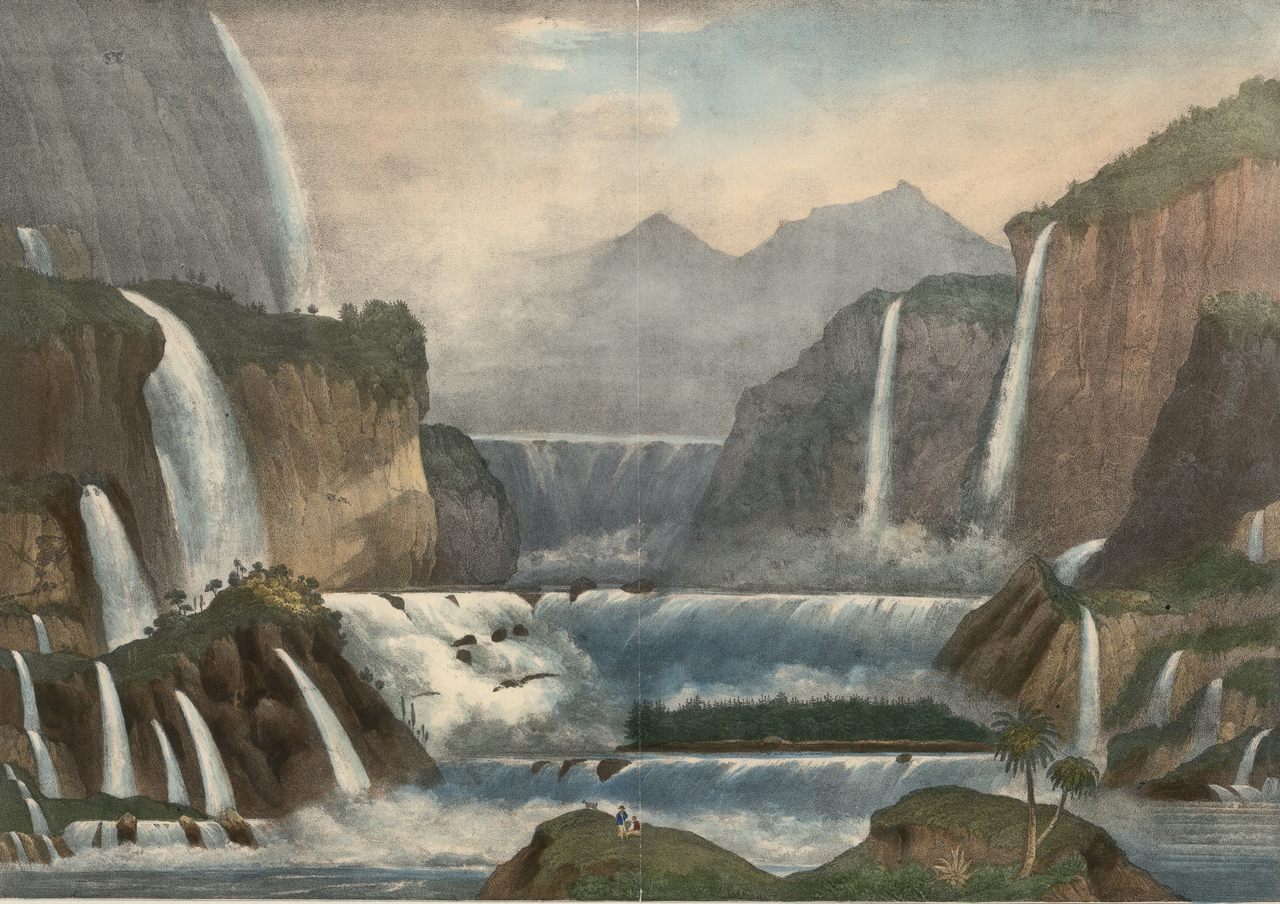
A single waterfall can be an overwhelming sensory experience, so imagine the sight and sound and feel of more than 40 thundering at once. In the 19th century, several mapmakers and geographers conjured this by stacking some of the world’s tallest, most forceful, or otherwise notable waterfalls on a single chart.

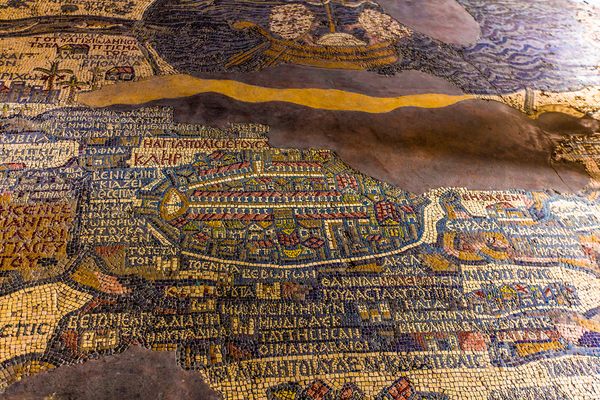
A handful of these are compiled in An Atlas of Geographical Wonders, From Mountaintops to Riverbeds, the first English edition of a French-language book by a quartet of cartography enthusiasts. The maps were part of a larger 19th-century cartographic trend, which coauthors Gilles Palsky and Jean-Marc Besse describe as “comparative fervor.” (The book, first published in 2014 as Le Monde Sur Une Feuille, is written by Palsky, Besse, Philippe Grand, and Jean-Christophe Bailly, whose professional bonafides range from landscape architecture to poetry.) Inspired, in part, by the earlier work of the roving Prussian naturalist, geographer, and chronicler Alexander von Humboldt, some 19th-century cartographers made sense of the world by relying on measurables and scale, and then comparing the world’s biggest and most spectacular features on a single tableau. They plotted imaginary vistas where the world’s tallest peaks became a single mountain range, or unusual bar graphs in which the longest rivers ribboned down a single chart in parallel squiggles.
The “great measuring of the world,” as Bailly calls it, fulfilled several aims, both individual and political. Printed in atlases that would have lined the bookshelves in a relatively wealthy, curious person’s home, the maps fed a fascination with remote places that few would ever see firsthand. They were also a way to mark, market, and celebrate colonial expeditions and explorers. “Altitudes and lengths invariably functioned as evidence of new discoveries,” Bailly writes, “providing a breeding ground for the fever of comparison and its accompanying tendency to produce visual records.”

Bailly and his coauthors reproduce an 1836 example by the London outfit of C. Smith & Son, on which the 19th-century printer rounded up more than three dozen waterfalls, from the majestic Cascade de Gavarnie (which they spelled “Gavarny”) in the Pyrenees, to one of the cataracts of the Nile River, where shallow rapids course over jagged rocks. The mapmakers organized the waterfalls by height, calculated “from the point of departure to the level of the basin into which they fall.” The chart includes singular falls and cascades from Norway, Colombia, Wales, Switzerland, Canada, Dalmatia, and more.
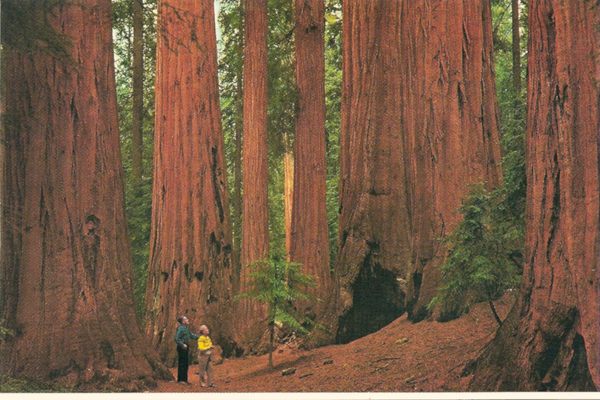
But as most any scientist will tell you, measurements are constantly reconsidered and refined, and map- and chart-making is as much art as science. A decade later, James Reynolds, another London publisher, produced a map that trod much of the same territory, but with a different cast of characters and new measurements for some of the recurring ones. The tallest and squattest waterfalls are the same on both charts, but their heights vary: The C. Smith & Son map places Gavarnie in the Pyrenees at 1,160 feet, compared to 1,280 in Reynolds. One of the Nile’s cataracts either falls at 35 feet, per C. Smith & Son, or 40, if you buy Reynolds’s account. Neither cites sources (at least not on the fronts of the charts, which are all that’s reproduced in the volume). Scale comes from the minuscule humans and animals in the foreground of each chart—dwarfed by nature’s majesty.
Many people don’t need convincing of the charm and spectacle of waterfalls, but Reynolds’s chart sets out to convince you anyway. Text at the bottom parses the differences between rapids, cataracts, and cascades and extols waterfalls as “among the most interesting and beautiful … works of nature.”

Comparative charts largely fell out of vogue by the end of the 19th century. In one of the book’s essays, Palsky and Besse suggest that the waning popularity had something to do with advances in mapmaking and printing. Maybe there was less need for comparison when you could print maps with sophisticated shading techniques—and then came photographs, which offered a new way to see the distant world.
But for a while, at least, the tableaux flattened the world and gave viewers a passport to its wonders. “The reader whose finger traces the line of a river or climbs a mountain peak—and in this way covers enormous distances in only a few centimeters—will discover the vastness of an immense and unknown world,” Bailly writes. “This world has been wholly compiled, and thus made wholly visible and readable on a single page.” That isn’t quite true, of course—people keep climbing mountains, measuring again and again, and seeing the world in ever greater detail. The charts never encompassed humanity’s emerging ecological and geological understanding of the world, but that hardly impedes the pleasure of viewing a simple, artistic chart of the planet’s marvels, and letting your eyes do the roaming.


Follow us on Twitter to get the latest on the world's hidden wonders.
Like us on Facebook to get the latest on the world's hidden wonders.
Follow us on Twitter Like us on Facebook