Disaster Response Now Includes Rapid Mapmaking
How data from satellites can help disaster response on the ground.

NASA’s rapid-response map of rainfall in Louisiana. (Photo: NASA/JAXA, Hal Pierce)
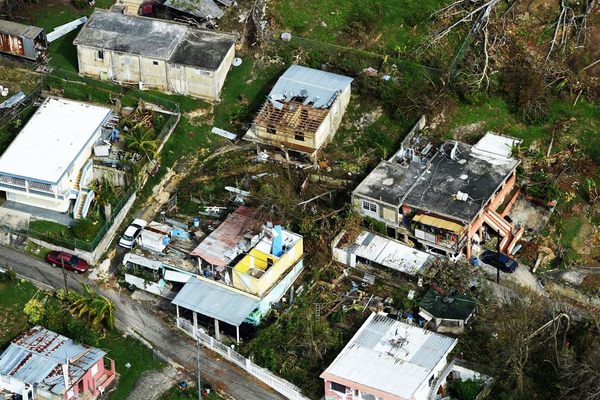
When Louisiana was hit with historic flooding, in August 2016, the federal government’s response teams went into action, including one relatively new one. At NASA, rapid-response mapmakers started pulling data from satellites and analyzing where the rain had fallen hardest—where the most help might be needed.
This rapid-response team, which, GCN reports, was only created in the past year, was using satellite data not just to monitor storms but to help with an on-the-ground response. And the NASA team wasn’t the only one leaning on information siphoned from satellites to create flood maps that could help disaster response. The Rapid Mapping service module of the European Union’s Copernicus program was also activated, and in the following days the flooding service produced 47 maps showing the affected areas before the flood, and the extent of flooded areas.
These quickly-made maps are just one example of an increasingly efficient and popular use of “satellite-based emergency mapping” (SEM), as part of the response to natural disasters. A recent paper ,published in Science, counts more than 1,000 SEM activations between 2000 and 2014. The frequency with which these tools are used has risen sharply; in 2000, there were 7 activations and in 2014, there were 123. “In almost all regions of the world, SEM activities have risen in number substantially during the past 5 years,” the authors of the paper write.
In August, for instance, the EU’s Copernicus service was activated for forest fires in Spain and Portugal, for a flood in Skopje, Macedonia, and for the devastating earthquake in central Italy. The speed of these responses has increased, too, from about 4.5 days in 2006 to 2.5 days in 2014, according to the Science paper.

Abbeville, La., reference map from Copernicus. (Image: Copernicus/European Union)

Abbeville, La., map showing flooded areas. (Image: Copernicus/European Union)
The goal in creating these maps is to speed and focus the response to disaster. They can show where the most damage might have occurred and mark changes in the days after. They can also be used to monitor disaster response. During the outbreak of Ebola in West Africa, for instance, the United Nations’ satellite program invoked the disaster charter so that WHO workers on the ground would receive free satellite imagery from space. They initially used those images to navigate remote areas where geographical information was limited; later, WHO workers used satellite imagery to check on the construction of treatment centers. (This was the first time SEM was used to respond to a health crisis.)
The growth of disaster response from space began three decades ago, when the UN’s General Assembly resolved that satellite capabilities should be directed toward this end—to “promote the protection of mankind from natural disasters.” By the mid-2000s, satellite mapping campaigns were regularly aiding disaster relief, in the wake of tsunamis, forest fires, landslides and earthquakes.
The 2010 earthquake in Haiti was a major turning point for the field: it was the first time satellite-based mapping was providing too much information. In just two weeks, mappers created more than 300 map products, of varying quality and varying use to people on the ground. It was largely unhelpful. Since then, a working group has created a series of guidelines to standardize the sorts of maps produced in this situation, and more coordination is in place to clarify which group will take on the response.
In the five years since, the use of SEM has become more routine, and the authors of the Science paper conclude that the initial hurdles to connecting satellite data to disaster operations have been overcome. There are plenty of opportunities to make use of it today: some of the disasters in which satellite-based emergency mapping has proven useful, like flooding and drought, are likely to become more common as global temperatures rise. It’s already happening: an early analysis of the August flooding in Louisiana attributes the extreme amount of rainfall to anthropogenic climate change.


Follow us on Twitter to get the latest on the world's hidden wonders.
Like us on Facebook to get the latest on the world's hidden wonders.
Follow us on Twitter Like us on Facebook