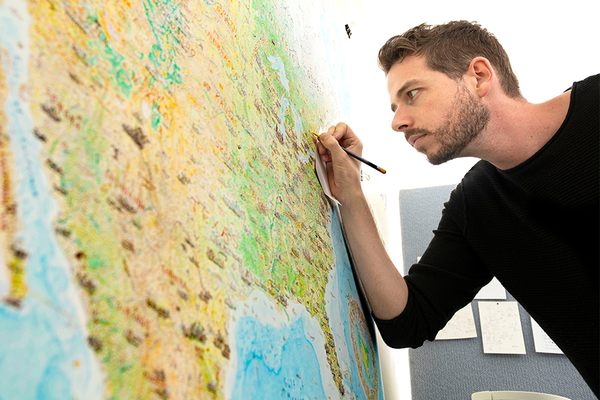
A Very Detailed, Interactive Map of Chicago’s Tree Canopy
It reveals some startling patterns.

In June, the Chicago Region Tree Initiative and Morton Arboretum released what they say is the most comprehensive tree canopy data set of any region in the U.S., covering 284 municipalities in the Chicago area. Now, that data is helping neighborhoods improve their environments and assist their communities.
“When we go to talk to communities,” says Lydia Scott, director of the CRTI, “We say ‘trees reduce crime.’ And then they go, ‘Explain to me how that could possibly be, because that’s the most bizarre thing I’ve ever heard.’”
In Chicago, where more than 2,000 people have been shot this year, scientists are looking at physical features of neighborhoods for solutions. “We started to look at where we have heavy crime, and whether there was a correlation with tree canopy, and often, there is,” says Scott. “Communities that have higher tree population have lower crime. Areas where trees are prevalent, people tend to be outside, mingling, enjoying their community.”
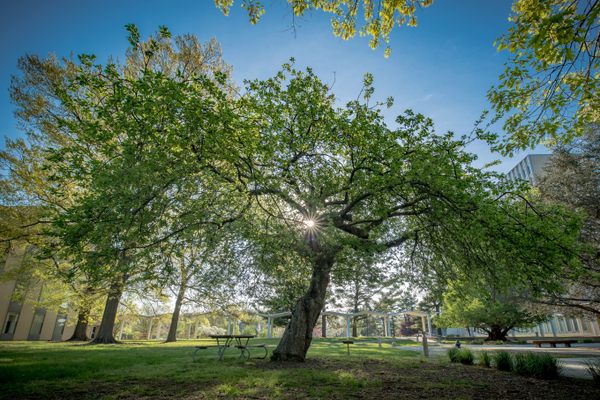
The map revealed that poorer neighborhoods are often “tree deserts,” areas with little or no tree canopy. Trees reduce flooding, improve property values, prevent heat islands, promote feelings of safety, reduce mortality, and provide other significant social and health benefits. This means that when you live in, for example, the South Side, where trees are scarcer, you lose more than just green leaves overhead.
Never before have researchers been able to look so widely and deeply at this sort of data. The map is huge—it covers seven counties—and extremely detailed. That has allowed Scott and her colleagues to notice some startling patterns. For example, in the North Shore community—an affluent, lakeside, suburban area—canopy cover tends to be 40 percent or higher. On the economically depressed South Side, canopy can be as low as 7 percent.
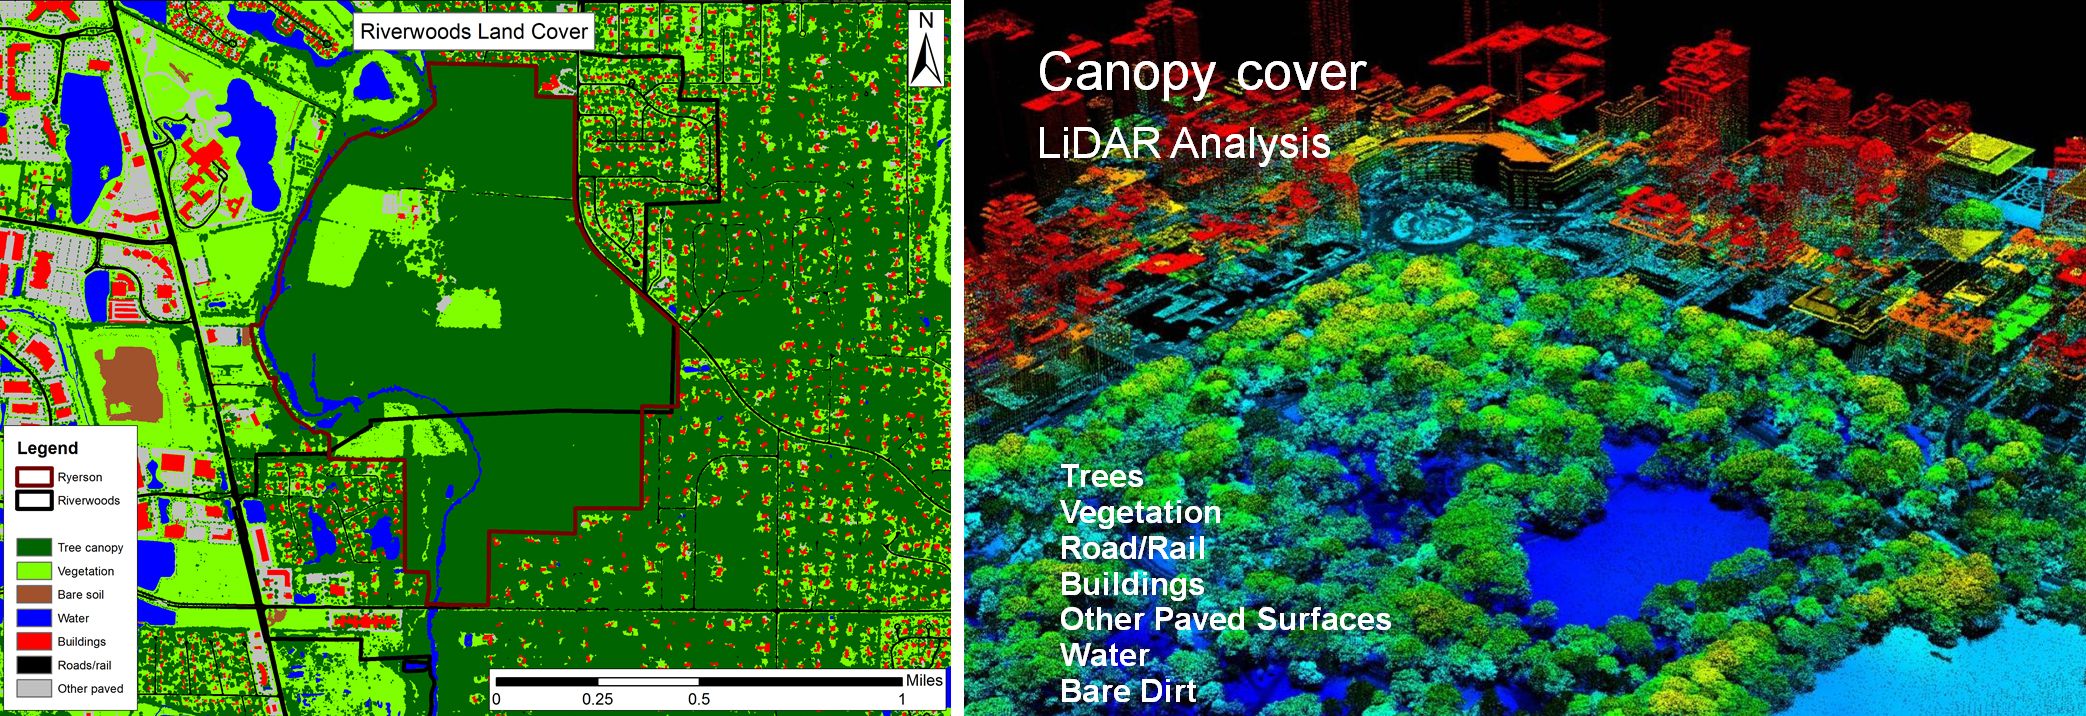
To make the map, scientists at CRTI, Morton Arboretum, the Field Museum, and other partner organizations overlaid a wide range of data sets to get the clearest, most holistic picture to date.* “We’re able to layer heat island data; demographic information such as age, vulnerable population, education background; we’re layering Medicaid claims because we know there’s a correlation between health issues—cardiopulmonary problems—and loss of trees,” says Scott.
Next, they combined that data with land cover and LIDAR imagery.* LIDAR, which stands for “Light Detection and Ranging,” is a remote sensing method. A plane with a small camera attached to the underside flies over neighborhoods, where it’s able to record height differences on the ground. That allows scientists to identify the layout of the tree canopy with an impressive degree of accuracy.
Of course, skeptics might argue that this sort of data is only correlation, rather than causation. Underserved communities have high crime and fewer trees—not high crime in part due to fewer trees. So to support their claims, CRTI compiled all the benefits that trees provide, with citations for the various studies backing up the claims. One of those studies suggests that trees “may deter crime both by increasing informal surveillance and by mitigating some of the psychological precursors to violence.”
Now, municipal leaders will work with CRTI to create custom solutions for their problems. For example, if an area is having floods, CRTI can show the town where upstream they need to plant trees. Just south of the city in the village of Dolton, which struggles with high crime rates and depopulation, Scott met with the mayor to determine which areas and what tree species they should focus efforts on to make the neighborhood safer and more pleasant.
Regardless, many of these efforts won’t pay off for years. Trees, obviously, need time to grow. In some ways, this planting will be a leap of faith.
But the trees do have immediate benefits in other respects. Blacks in Green is a Chicago-based economic development organization that aims to create self-sustaining black communities through green initiatives. “We’re using the green economy to galvanize, organize, energize,” says founder Naomi Davis. Davis has met with Scott and CRTI multiple times over the last few years in order to plan BiG’s approach. “When you’re starting something, you should take stock of what you got,” Davis says. “We realized we were going to need to start with a tree inventory. Now we’re finally getting that inventory.”
In 2015, BiG purchased a vacant lot in Chicago’s West Woodlawn neighborhood from the city for $1. They’ve now created a fruit and nut orchard in that lot, with plum, crabapple, and pawpaw trees. “We are looking at what it would mean to have a green, healthy space in a blighted African-American neighborhood…We have a really nasty, barren, burnt out commercial corridor, which is 61st Street. Last year we planted about 45 trees there.”
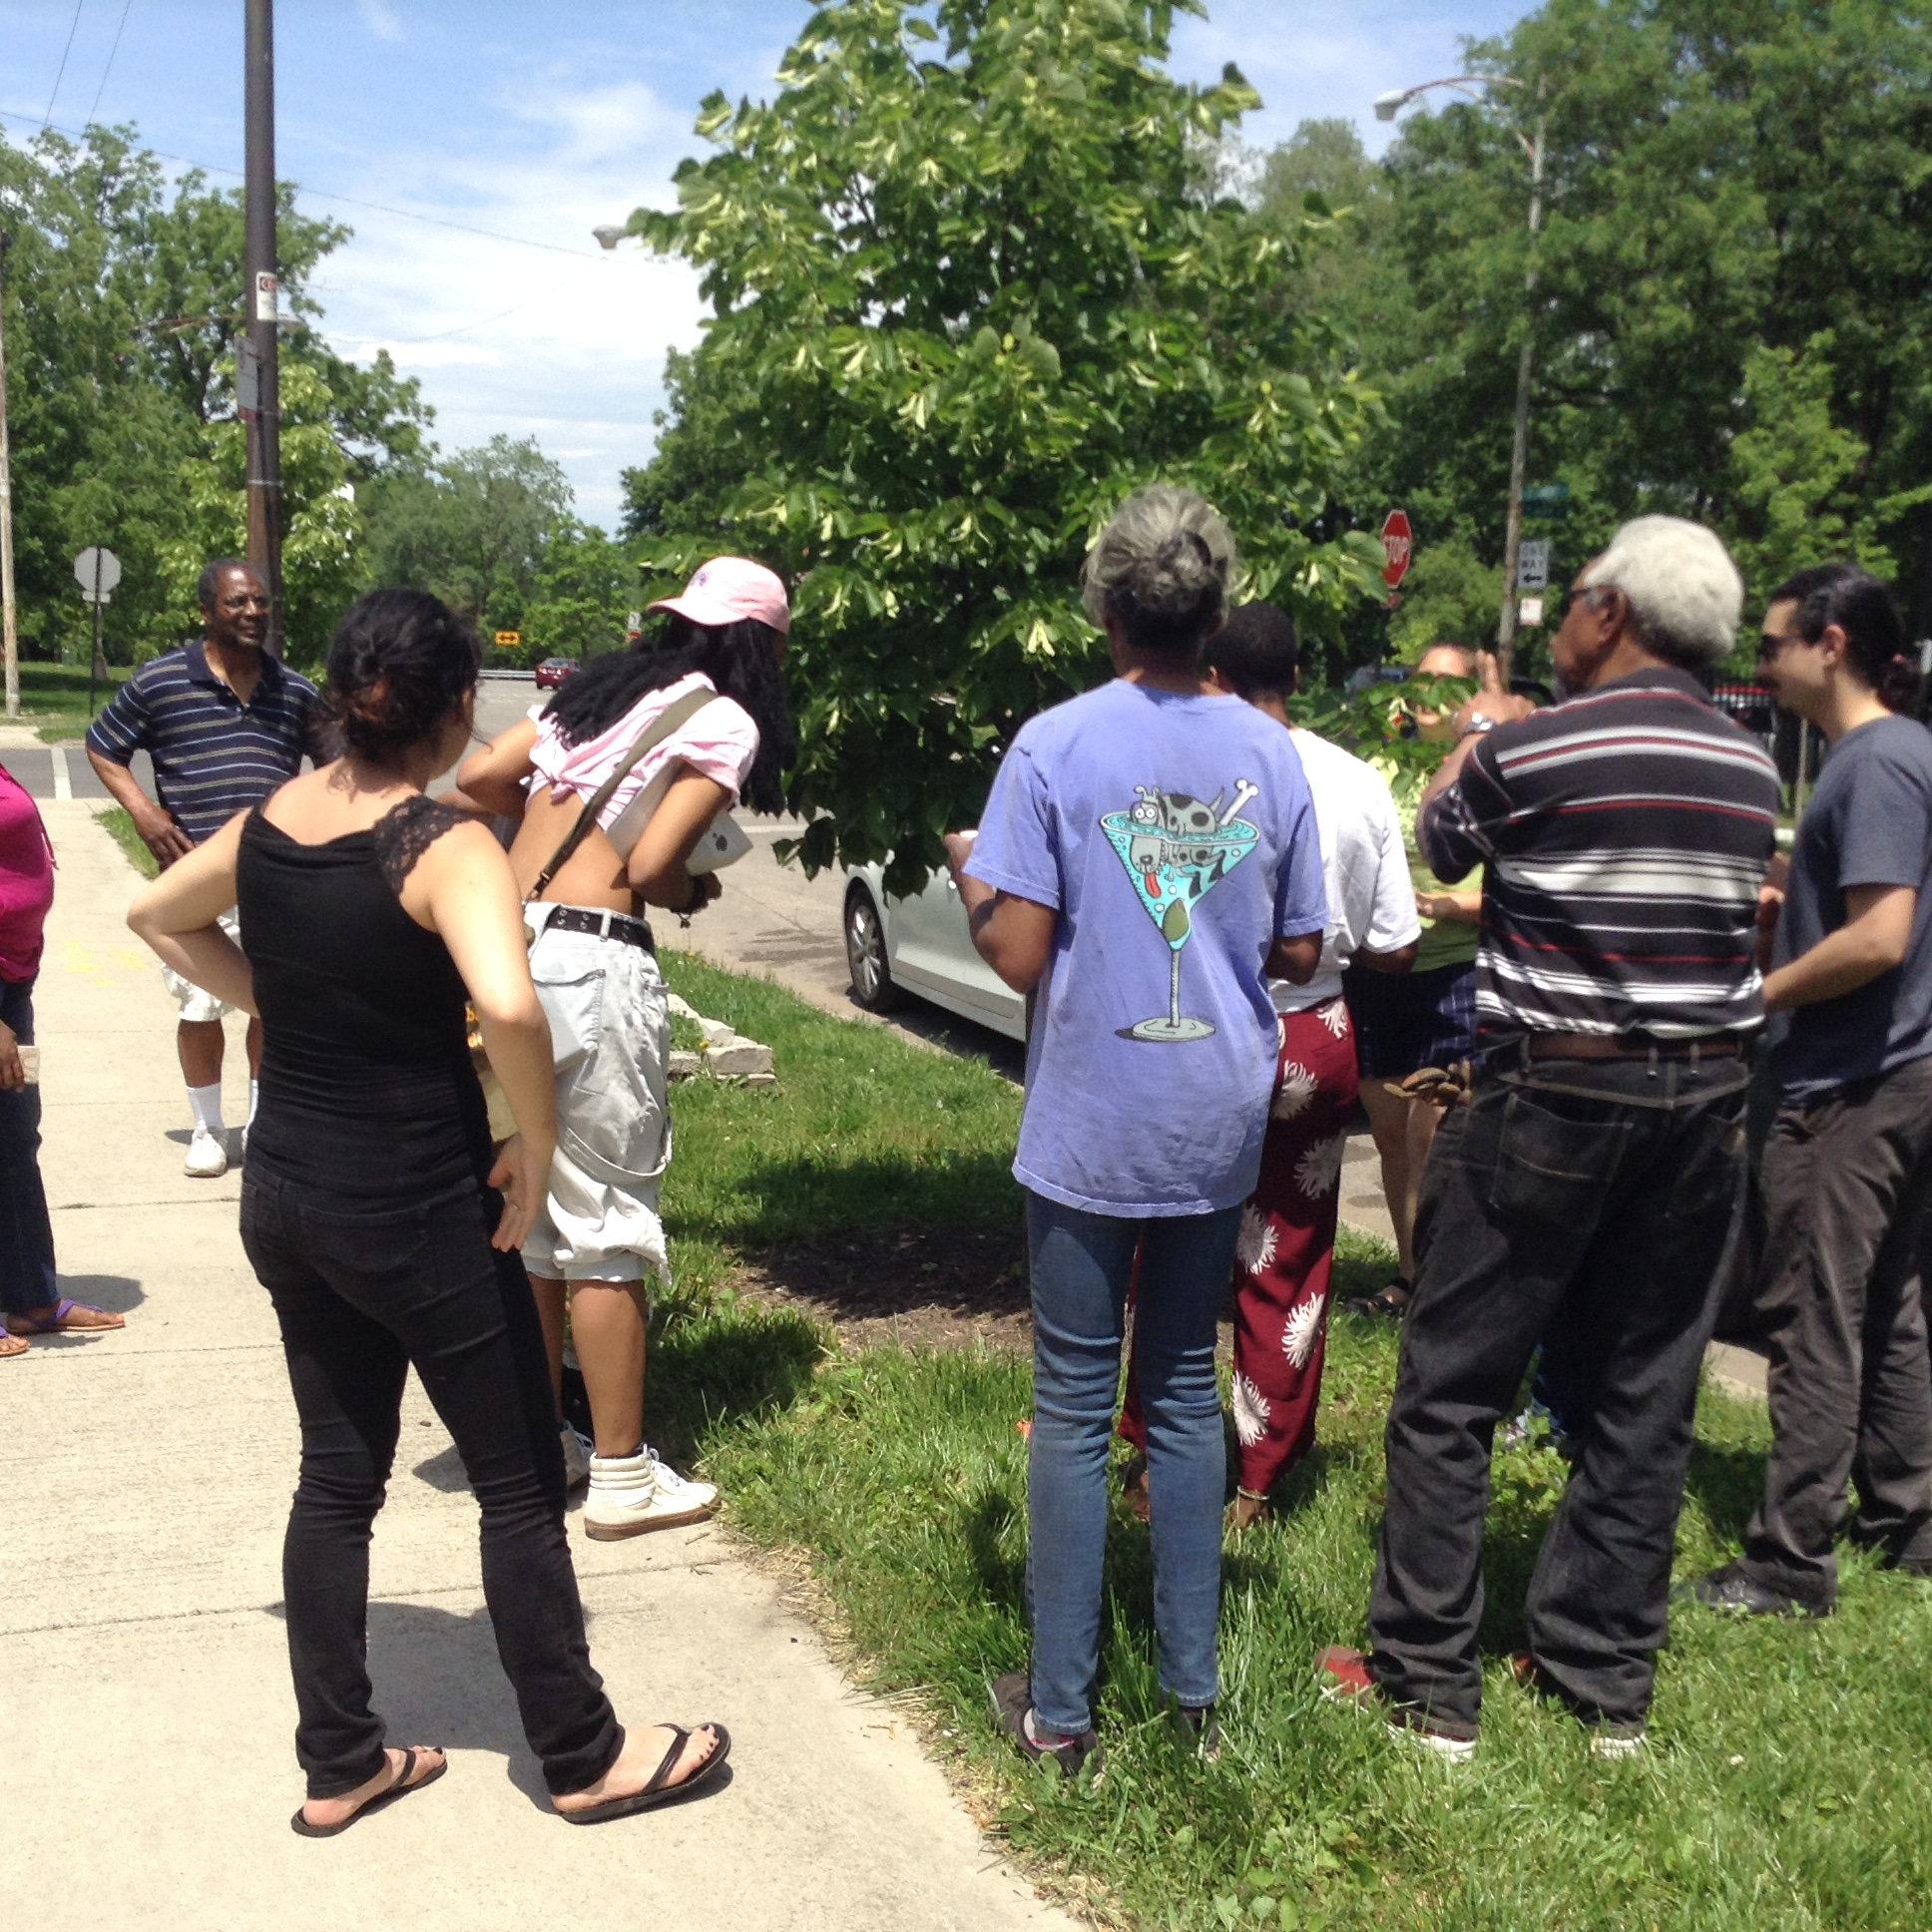
Both Scott and Davis agree that when people come out to plant, they’re amplifying community interaction and bonding. Additionally, the community training also introduces people to skill sets they didn’t have before. BiG has put two students from the neighborhood through a certified tree-keeping course.
Davis is also enthusiastic about the potential jobs. “This is something that is a strong career for good-paying wages,” she says. “We’re gonna need more trees than ever to be planted because of climate change.” BiG will have a horticulturalist career fair in October. “In a neighborhood where unemployment is so high,” she says, it’s a game-changer.
“It’s making people excited about their neighborhood,” says Scott. “They use to walk by and not notice. Now they’re starting to look up.”
*Update 9/1/2017: This post has been updated to reflect a more comprehensive list of the organizations involved with the map as well as the types of data used to create the map.


Follow us on Twitter to get the latest on the world's hidden wonders.
Like us on Facebook to get the latest on the world's hidden wonders.
Follow us on Twitter Like us on Facebook