How a Father And Son Helped Create Weather Forecasting as We Know It
Without Jack and Vilhelm Bjerknes, and two world wars, we might not know if it’s going to rain tomorrow.
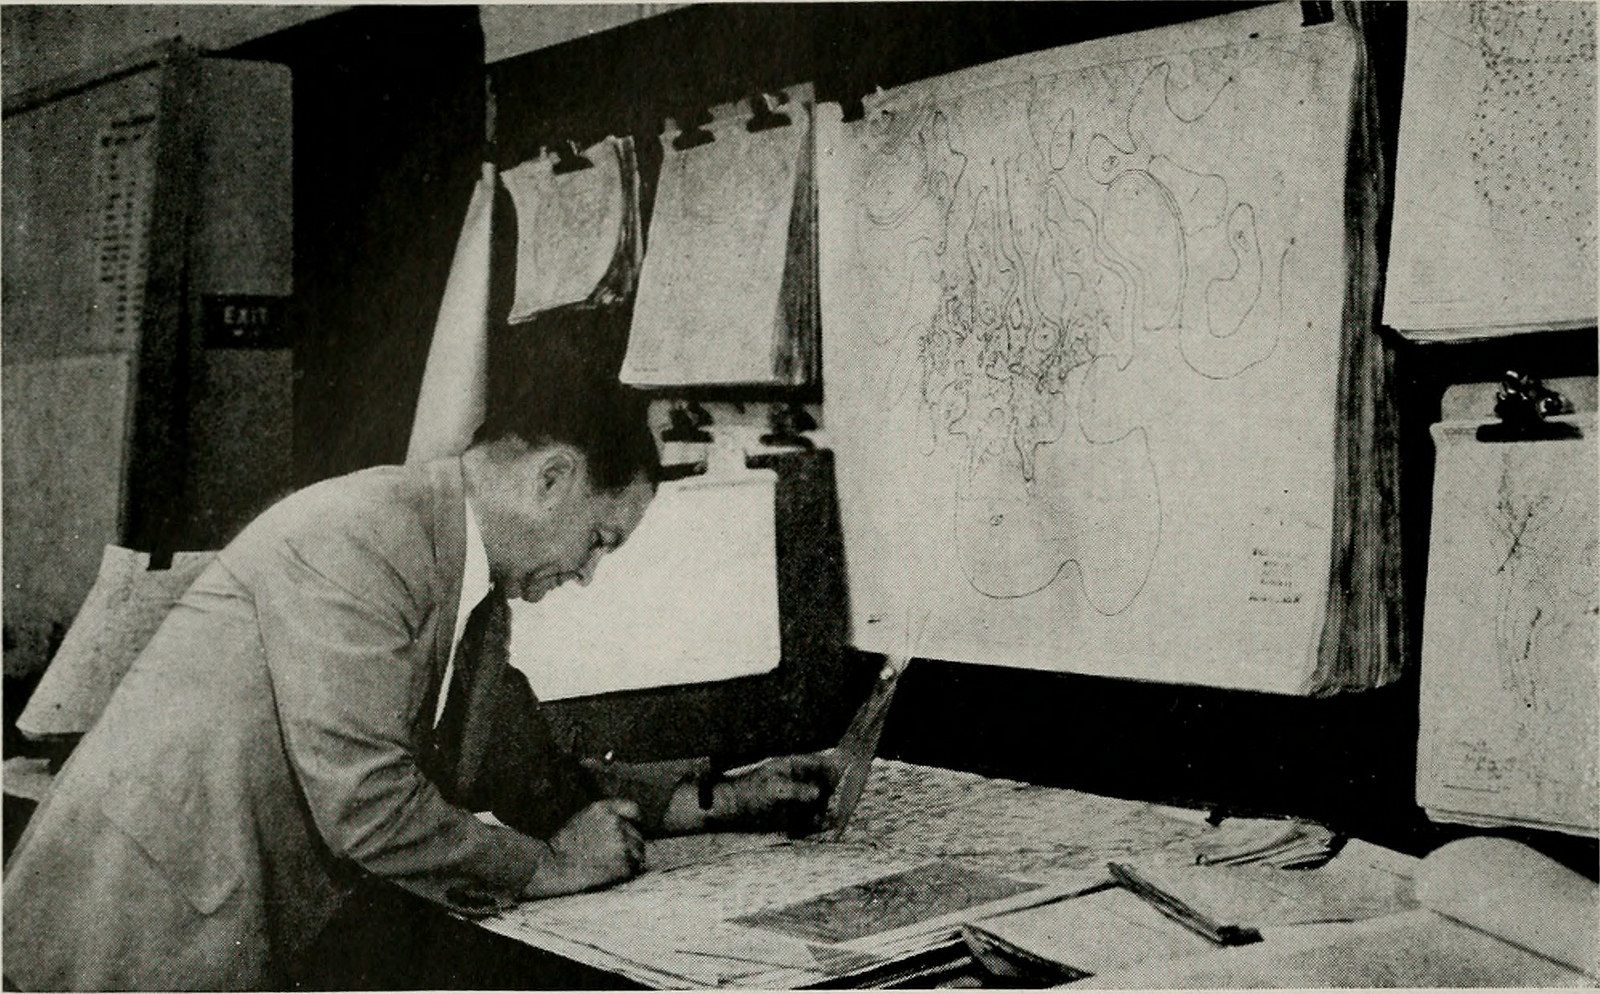
It’s an almost supernatural ability that most of us take for granted: at any given time, almost anywhere in the world, we can know the weather of the future. It’s all laid out for us, often on maps that show the movement of weather like armies colliding mid-air: triangles for cold fronts, half-circles for warm, and a mix of the two for occluded fronts, where a cold front overtakes a warm.
It wasn’t always this way. Though the very first committee dedicated to collecting and mapping weather data—the Franklin Institute in Philadelphia—was formed in 1831, all of the maps they produced had to be drawn after weather had already occurred. Predicting the weather remained largely based on superstition, like the famous “red sky at night, sailor’s delight” rhyme. In the mid-1840s, the newly-elected secretary of the Smithsonian Institution expressed his frustration with the lack of progress in meteorology. The Smithsonian’s new program, he said, would focus on “solving the problem of American storms” James Fleming writes in his book, Meteorology in America—and yet American storms remained a problem.
That all changed in the late 1800s and early 1900s, in no small part due to the work of a father and son pair of Norwegian geophysicists, Vilhelm and Jacob Bjerknes. The Bjerknes dedicated their lives to understanding the workings of our atmosphere, and in doing helped produce the weather models that we know today—and which are still based in the work the Bjerknes did almost 100 years ago.

Jacob Bjerknes and the future of weather forecasting were born in same year. That year, 1897, Jacob’s father Vilhelm had a breakthrough: he figured out a theorem that describes the motion of a vortex in a non-homogenous fluid—like the air masses interacting in our atmosphere, Fleming writes in Inventing Atmospheric Science. Vilhelm was sure that his calculations could be used to develop a system of predicting the weather, in all its complexity, days ahead of time. This was the aim of his work: as he would lay out in 1902, “The goal is to predict the dynamic and physical condition of the atmosphere at a later time, if at an earlier given time, this condition is well known.”
When applied to the motions of the ocean and the atmosphere, Vilhelm believed his new theorem should allow weather forecasting to be handled as a problem of mathematical physics, just like a calculation of friction or gravity. At the time, this concept was a revolutionary one.
In 1913, Vilhelm became director of a new geophysics institute at Germany’s University of Leipzig, where he was surrounded by talented students—one of them, Vagn Walfrid Ekman, would become known for his eponymous theory describing how wind drives the circulation of water currents (an idea that came to him one evening at a dinner party). By 1915, this group also included Vilhelm’s son Jacob, whom everyone called Jack.
It was not the easiest time for the Bjerknes’ studies. In July 1914, Austria-Hungary declared war on Serbia. Germany joined the fray only days later, setting World War I into motion. Much of the institute’s German students and staff were called into service, leaving the institute short-handed. Recent progress in the field also suffered. The first daily scientific maps displaying the globe’s weather, issued by the United States’ Weather Bureau, had to be suspended only seven months after the program began, when the war halted European telegraph transmissions. This must have been a particularly disappointing blow for Vilhelm—years earlier, he had suggested that weather observations and computations be combined on charts, allowing scientists to graphically derive maps in sequence, “just as one usually derives one equation from each other,” Fleming observes. In a 1914 letter to the Carnegie Institution, one of his biggest funders, Vilhelm wrote worriedly: “I hope that the most unnecessary and most cruel of all wars shall not disturb the work which I am performing …”
Yet this was just the beginning of the curious entanglement of the military and war with the Bjerknes’ work—indeed, its entanglement with the development of weather forecasting itself.
In 1916, Herbert Petzold, one of Vilhelm’s doctoral students, was killed at the battle of Verdun. Though Vilhelm had written only a year earlier that his son was “still too young to devote himself to this work,” Jack took over Petzold’s studies, which examined the movement of “convergence lines,” or distinct masses of air in the atmosphere. Shortly afterward, Jack published his first scientific paper, describing that these lines of wind could be thousands of kilometers long, that they tended to drift to the east, and that they had some connection with clouds and precipitation.
By 1917, the fighting in Germany drove the Bjerknes’ to flee for their native soil. “I am now back again in Norway, not merely for a summer journey, but forever,” Vilhelm wrote solemnly. The elder Bjerknes became a professor at the new Geofysisk Institute at Norway’s Bergen Museum, where he developed the school of weather analysis that would become known as the Bergen School.
The Norwegian coast became the school’s laboratory: through negotiations with the government, Vilhelm increased the number of weather observing stations in the south by nearly tenfold. Jack and two other students were set up as forecasters. With the war severely limiting supplies—the scarce winter of 1916–17 became known as the Kohlrūbenwinter, or turnip winter—Vilhelm’s goal of figuring out how to predict the weather was not just a scientific quest, Fleming notes, but a practical one, one with the urgently needed goal of “assist[ing] the production of breadstuff.”
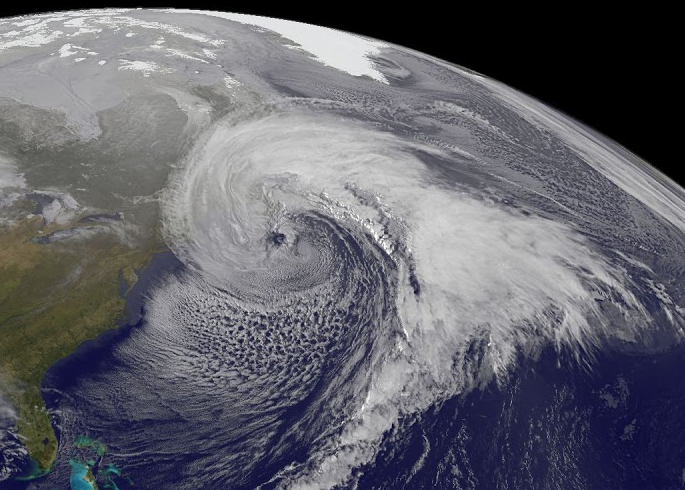
The plethora of weather data the Bjerknes were receiving also allowed Jack to continue monitoring convergence lines and refining his theory. By the fall of 1918, he had made a discovery: these lines of weather were connected with cyclones—large air masses that rotate around low atmospheric pressure. He published his observations in 1919. Though he didn’t yet know it, Jack had identified one of the most characteristic features of weather maps and weather forecasting. These features, too, would be linked with war, named for their resemblance to the lines of advancing armies. Jack Bjerknes had discovered the “front.”

The Bergen School continued to work off of Jack’s theories through the course of World War I. The school used mathematical analysis and data from their weather stations to revolutionize its weather maps, including the differing lines of convergence that would later be known as “cold fronts” and “warm fronts,” and the fronts colliding in a process that Jack discovered and called occlusion. Another member of the Bergen school, Tor Bergeron, proposed the symbols currently used for different types of fronts—though it would take several decades before the symbols were adopted as the standard.
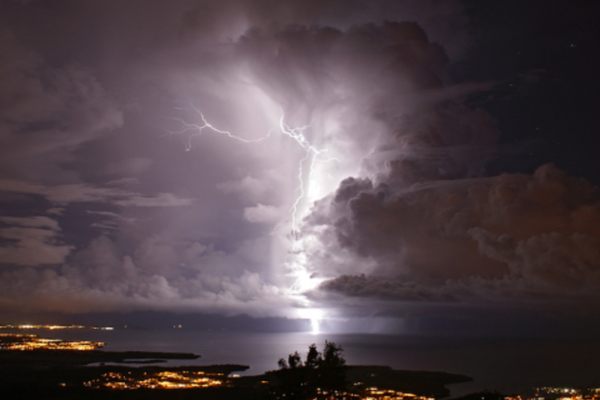
By the end of the war, the Bergen School had developed realistic structural models which laid out a set of rules for how storms would behave: how they would form, where they might move, and how they could disperse or intensify. This life cycle is intimately connected with the weather forecast. With such rules, dubbed the “Norwegian frontal cyclone model,” the Bergen school sought to remove subjectivity from meteorology, and to transform it into a science.

Jack and Vilhelm’s physical paths split in the early 1920s, though their scientific goals remained united. Jack Bjerknes became the head of the Weather Forecasting Office for western Norway from 1920 until 1931. In 1926 Vilhelm moved to a professorship at the University of Oslo, where he remained until his retirement in 1932. He would remain scientifically active through his later years, up until his death in 1951. After leaving the Weather Forecasting Office, Jack followed in his father’s footsteps, teaching meteorology back at the Bergen Museum.
The 1920s were a time of exciting advancement in meteorology. The development of radio technology allowed faster and more detailed transmission of weather information; by 1922, 98 stations across 35 U.S. states were verbally broadcasting weather reports, forecasts, and advisories. That year also saw the beginning of an exchange of weather observations between France and the U.S. Weather Bureau, to be broadcast from the top of the Eiffel Tower to other European services. By 1924, pressure maps were being drawn daily for the northern pole and much of the Northern Hemisphere.
Yet it wasn’t long before war again caught up with the world, the younger Bjerknes, and his work. In July 1939, Jack and his family—his wife Hedvig Borthen and their two children—departed for a lecture tour in the United States. It was supposed to be an eight-month trip. But in April 1940, Nazi Germany invaded Norway. Almost immediately, the Norwegian weather alert service was forced to halt its work, and all weather transmissions. The Bjerknes family’s visit to America became a permanent one.

To the Allied war effort, of course, the expatriate (and soon citizen) Bjerknes was a valuable resource. With accurate weather information urgently needed by troops, the U.S. Air Force asked Jack to lead a new school for training Air Force weather officers. Jack chose the University of California’s Los Angeles campus for his school. The Department of Meteorology that he would develop there rapidly grew into one of the world’s leading centers of atmospheric science, and remains at the forefront of the field today.
Meanwhile, the model that the Bergen School had developed finally began widespread implementation—also thanks to the war. In 1942, the U.S. Army Signal Service began a new service to gather and distribute weather data, which would one day be combined with the Weather Bureau Air Force-Navy (WBAN) Analysis Center, the central source of weather charts and maps for national distribution. Late in 1942, it also began the first formal analysis of fronts on surface maps, using the Norwegian cyclone model.
As weather forecasting advanced over the following decades, Jack Bjerknes’ focus would turn to larger questions about our atmosphere; he was the first to identify that El Niño, previously known only as a phenomenon local to Peru, was actually the result of a global oscillation, and that it had significant impacts all over the world. After his death in 1975, biographer Arnt Eliassen wrote that “more than any other atmospheric scientist, Jack Bjerknes managed to create order and system in a seemingly disorderly atmosphere.”
Indeed, while our increased understanding of the atmosphere, along with technology like satellite observation, has modernized weather maps beyond what the Bjerknes might have ever imagined, the theory that informs these predictions is the same. Much of weather forecasting today remains grounded in the Norwegian cyclone model, and the Norwegian cyclone model owes its existence to Jack and Vilhelm Bjerknes.
Update 12/8: An earlier version of this story did not properly credit research in James Fleming’s books, Meteorology in America and Inventing Atmospheric Science. We regret the omission.


Follow us on Twitter to get the latest on the world's hidden wonders.
Like us on Facebook to get the latest on the world's hidden wonders.
Follow us on Twitter Like us on Facebook