Antarctica Is Losing 250 Billion Tons of Ice Per Year
For nearly 40 years, this loss has accelerated at a devastating clip.
In the fall 0f 2018, we learned that climate change was proceeding at an even more alarming rate than we had thought. The United Nations’ disturbing October report, which warns of a crisis by 2040, is reinforced by new research demonstrating the harsh acceleration of Antarctic ice loss since 1979: By 2017, Antarctica was losing more than six times as much ice per year as it did nearly 40 years prior, according to a study published in the Proceedings of the National Academy of Sciences.
Between 1979 and 1990, the researchers explained in a release, Antarctica lost, on average, about 40 billion tons of ice per year (or 40 gigatons, if you prefer). That’s not exactly slim, but it hardly compares to Antarctica’s average annual ice loss between 2009 and 2017, which weighed in at more than 250 billion tons annually. The researchers, from the University of California, Irvine, and Utrecht University in the Netherlands, say that the four-decade study is the longest analysis of Antarctic ice mass ever conducted. They looked at a total of 18 regions comprising 176 basins, plus some additional surrounding islands.
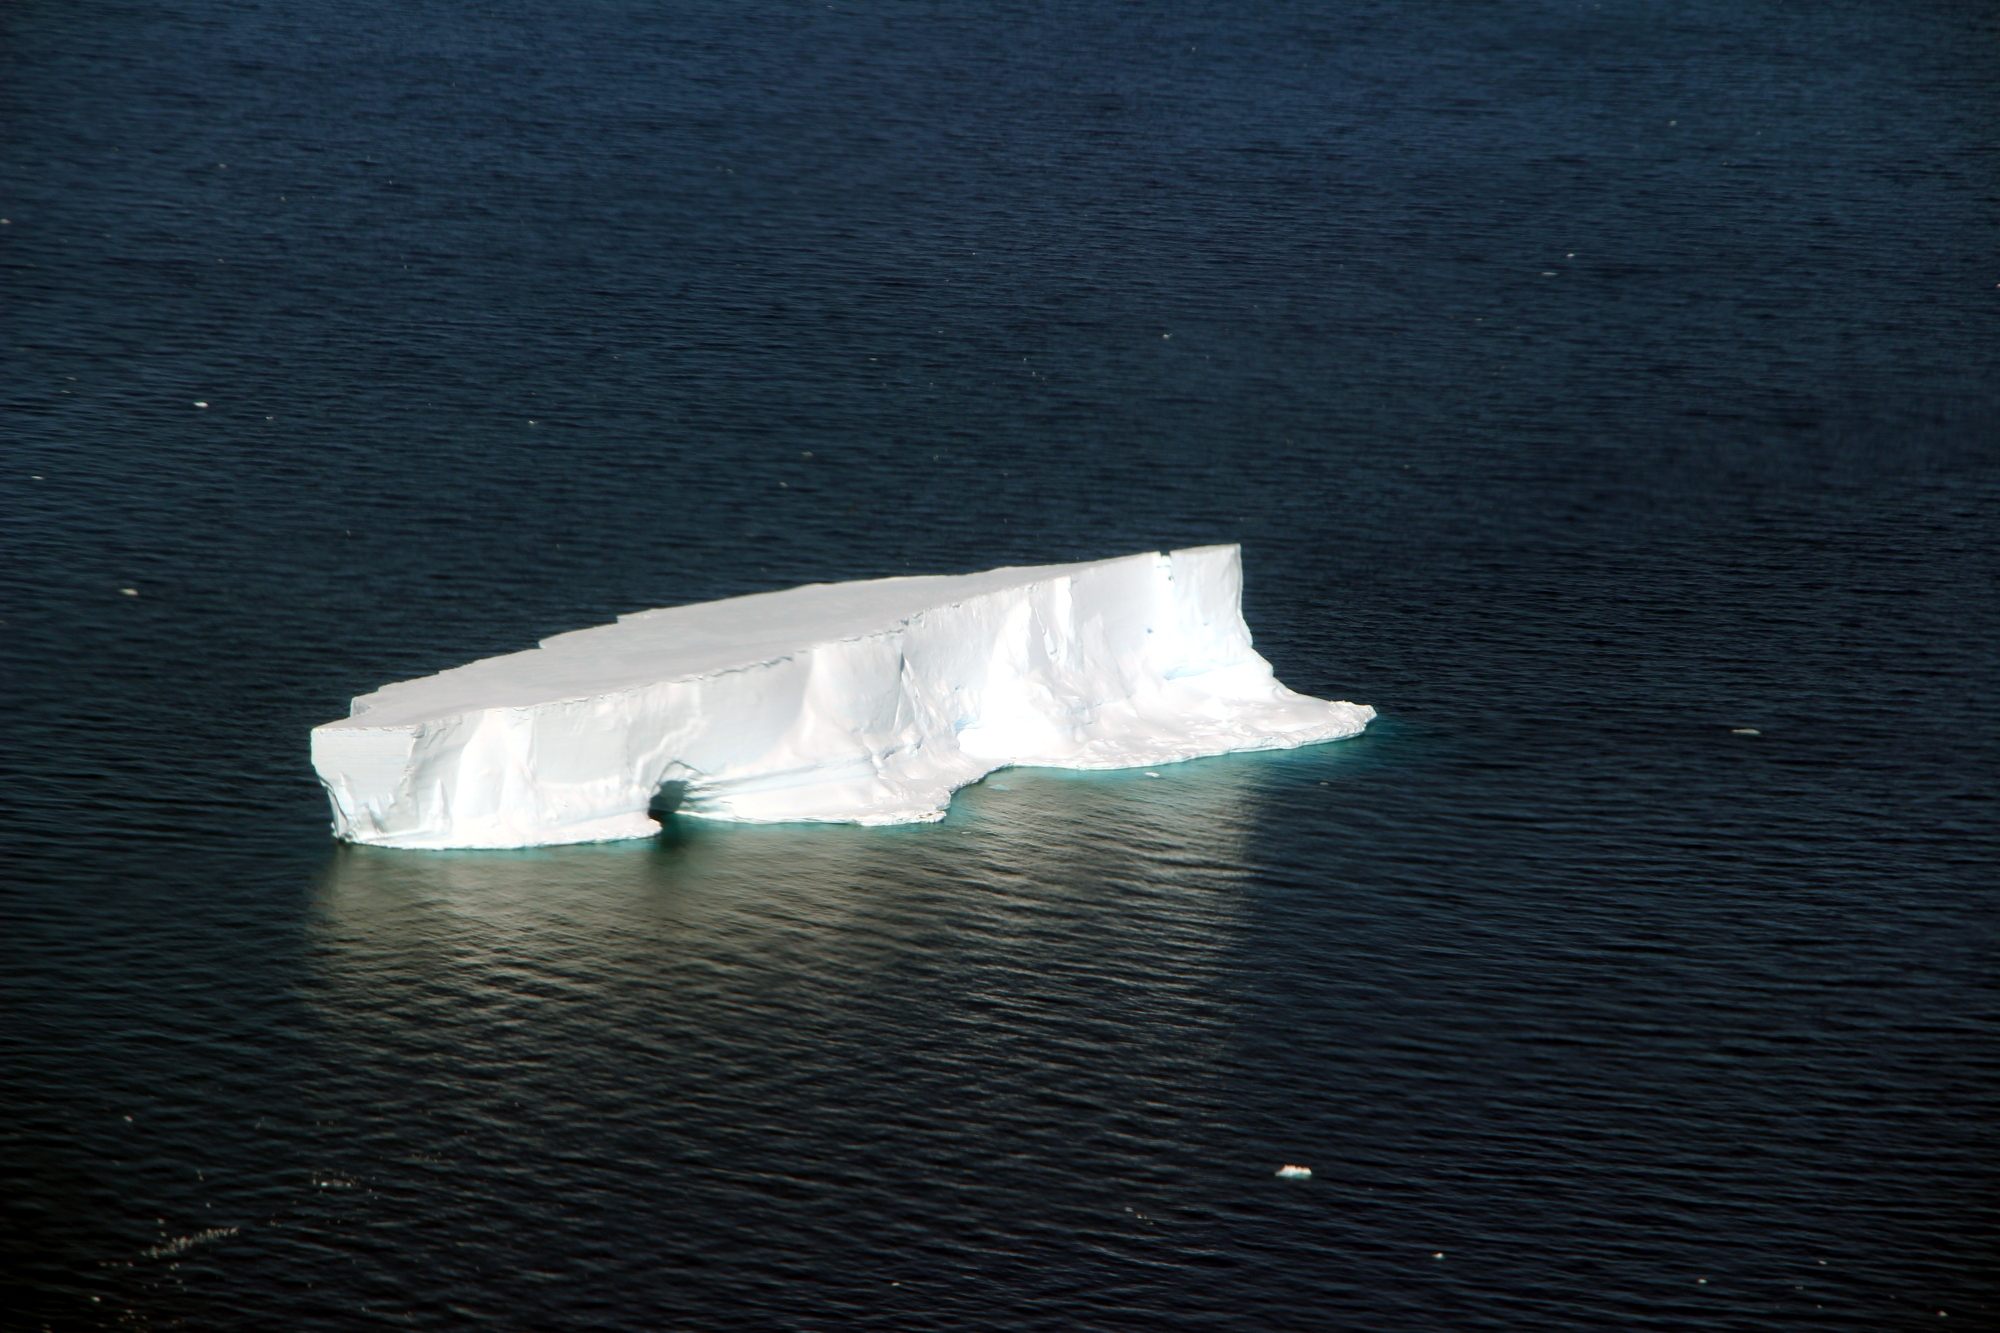
To gather the data, the team used aerial photos from NASA’s Operation IceBridge, taken from a height of about 350 meters, along with Landsat satellite images dating back to the 1970s. The team also used satellite interferometry data, taken by measuring the surface with beams of light. These tools helped the researchers compare levels of snowfall against ice discharge at glacial “grounding lines,” the spots where ice detaches and starts floating in the ocean. With over 250 billion tons of Antarctic ice now sliding into the ocean every year, the researchers say sea levels will only continue to rise beyond the levels already observed in the nearly 40-year analysis. During that time, they rose by more than half an inch.
Another key finding from the study reveals the role of East Antarctica’s Wilkes Land sector in these decades of ice loss. Consistently, said UC Irvine’s Eric Rignot in the release, this area has made major contributions to the ice loss and is thus “probably more sensitive to climate [change] than has traditionally been assumed …” That’s particularly problematic looking ahead, as Wilkes Land, for now, contains more ice than West Antarctica and the Antarctic Peninsula combined.
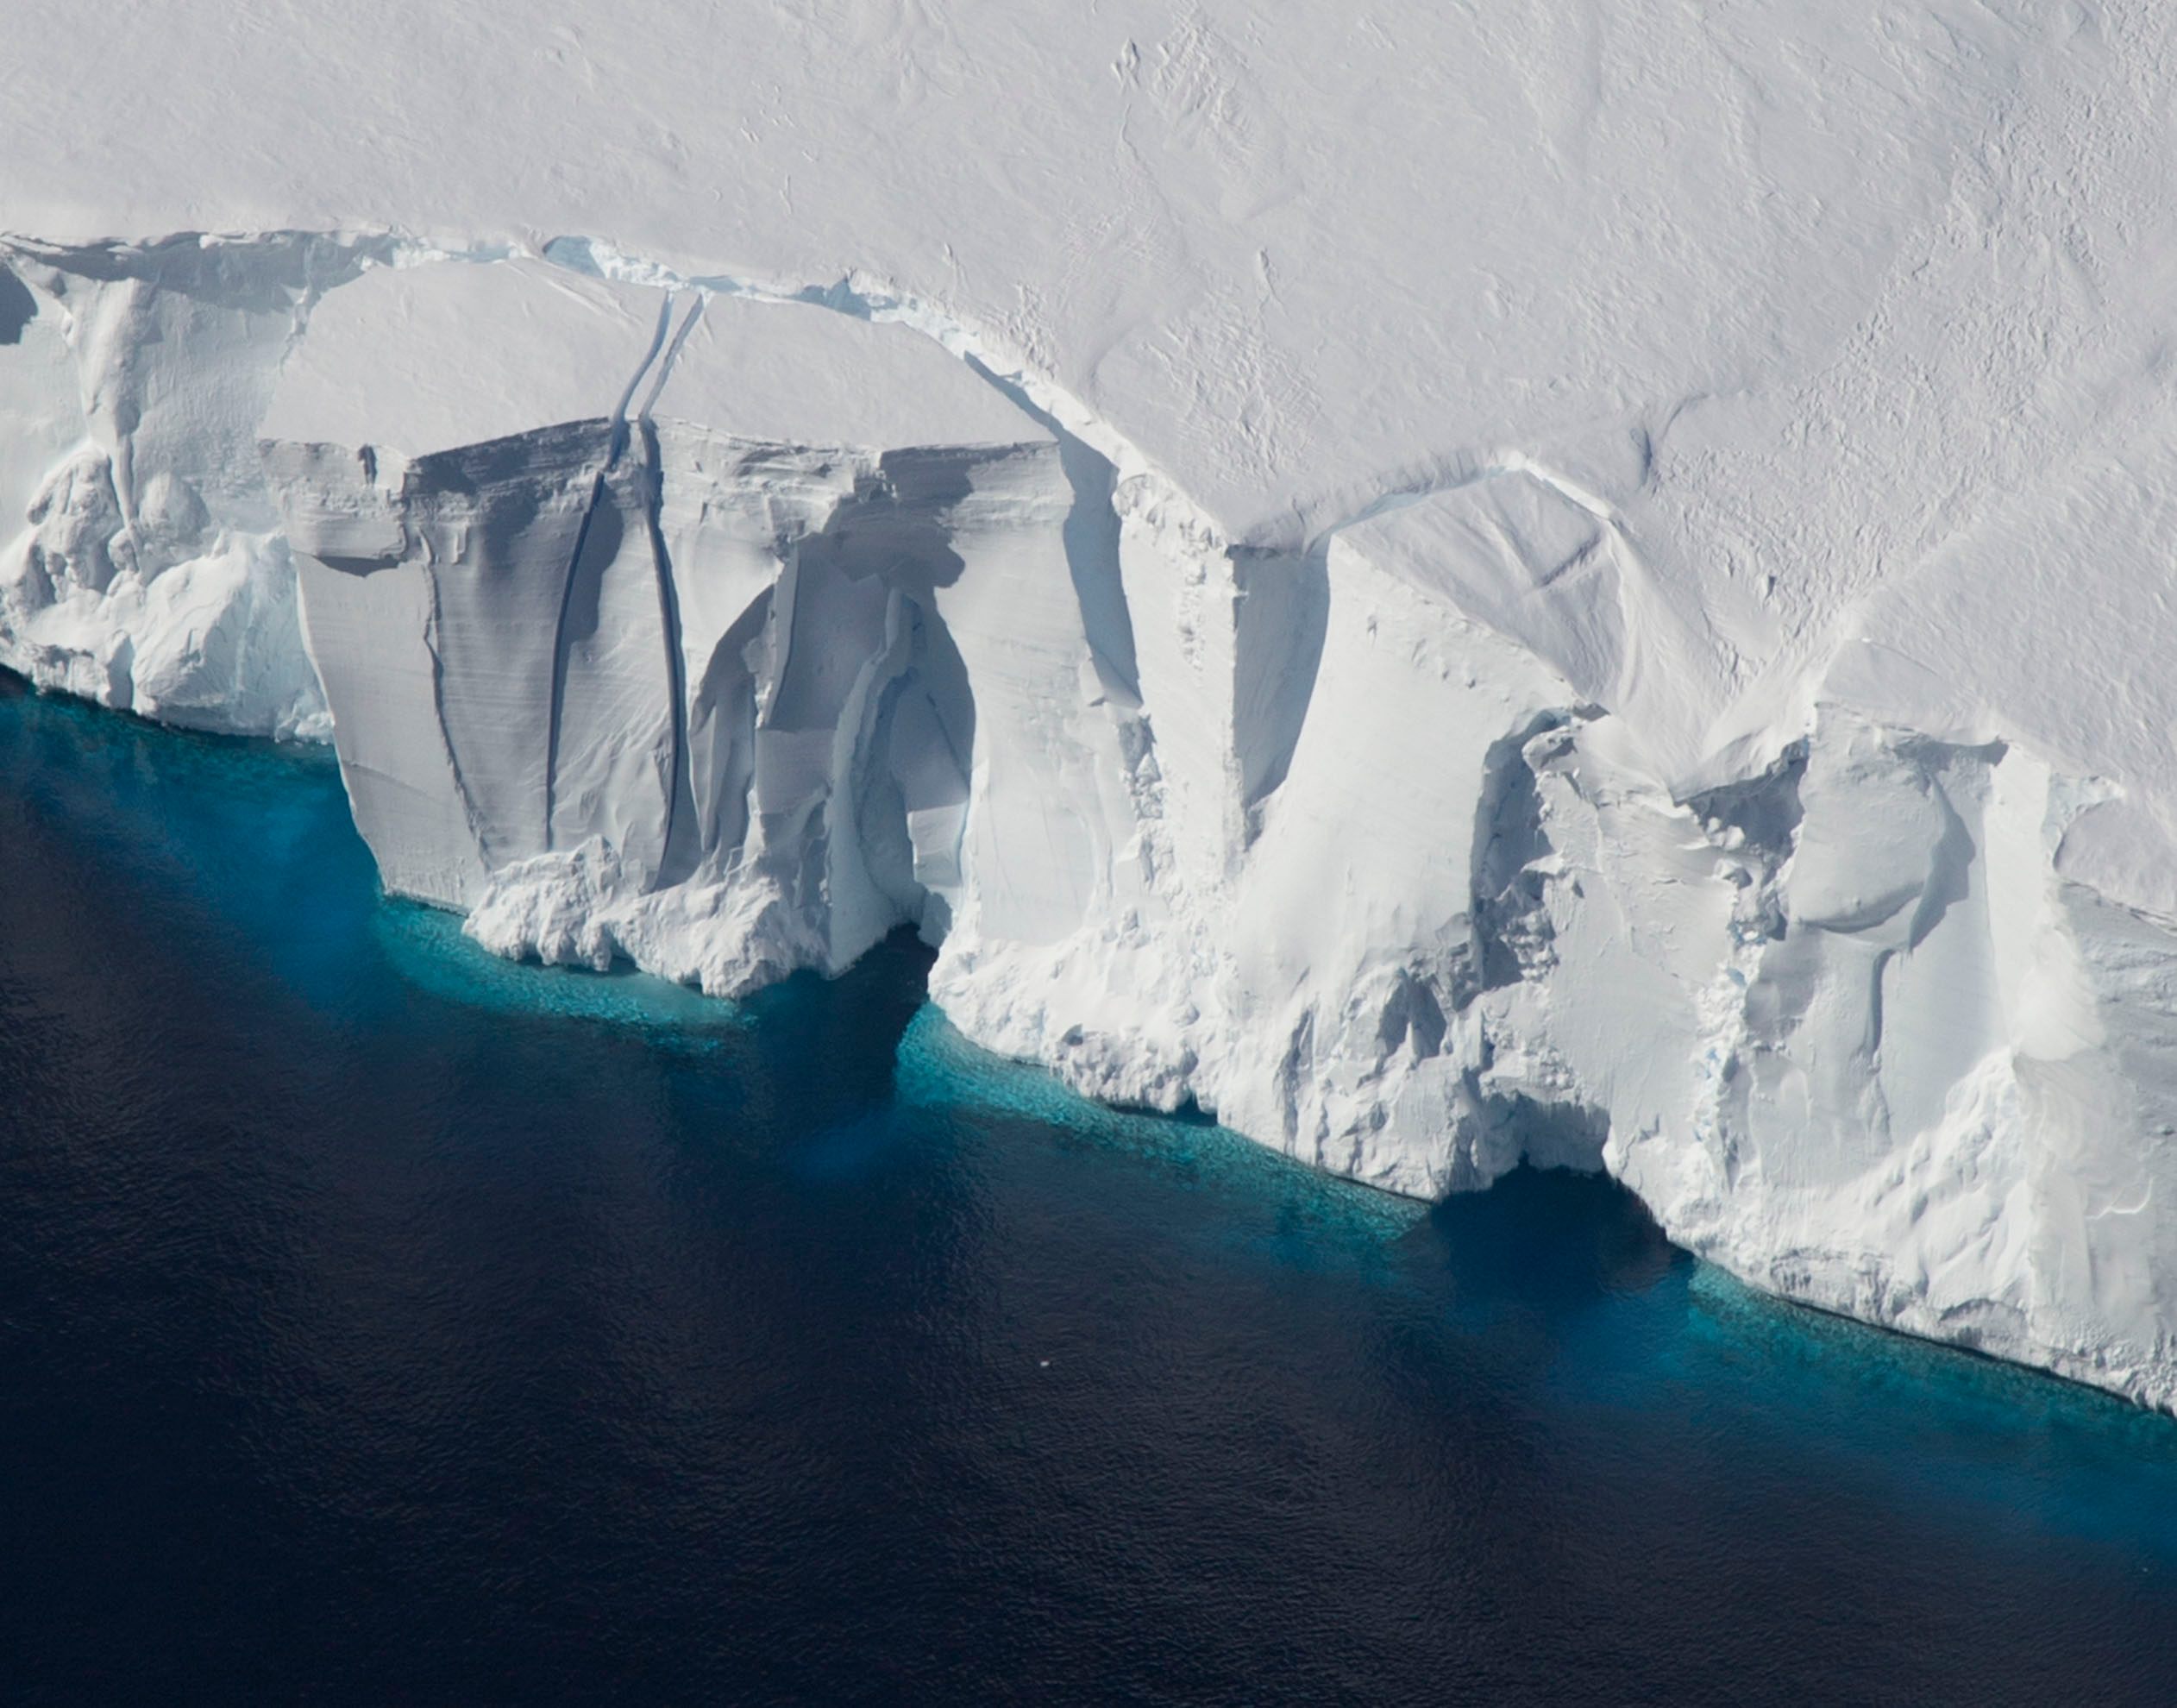
The study coincides with another report, also published today in Nature Geoscience, that illustrates the Antarctic ice sheet’s vulnerability to melting. According to a release, the ice sheet—“the largest single mass of ice on Earth”—could raise sea levels by about five meters if melted.


Follow us on Twitter to get the latest on the world's hidden wonders.
Like us on Facebook to get the latest on the world's hidden wonders.
Follow us on Twitter Like us on Facebook