The Surprising Science of Measuring Snowfall
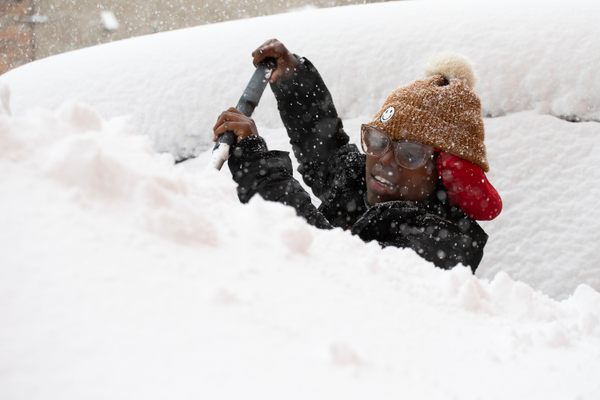
When a winter storm wallops a region, an army of volunteers springs into action—but exact totals can be tricky.


This story was originally published on The Conversation and appears here under a Creative Commons license.
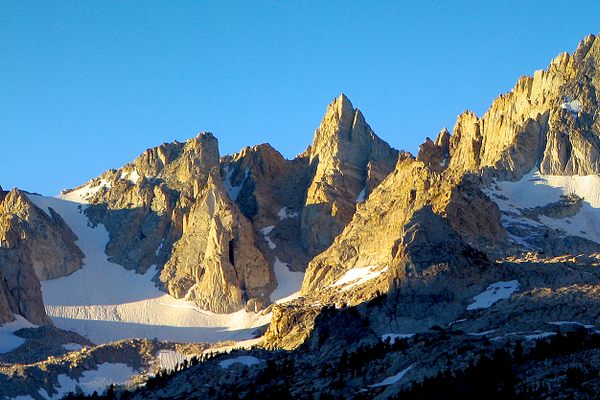
The Blue Hill Observatory, a few miles south of Boston, recorded the deepest snow cover in its 130-year history, an incredible 46 inches, in February 2015. The same month, Bangor, Maine, tied its record for deepest snow at 53 inches. Mountainous locations will sometimes see triple-digit snow depths.
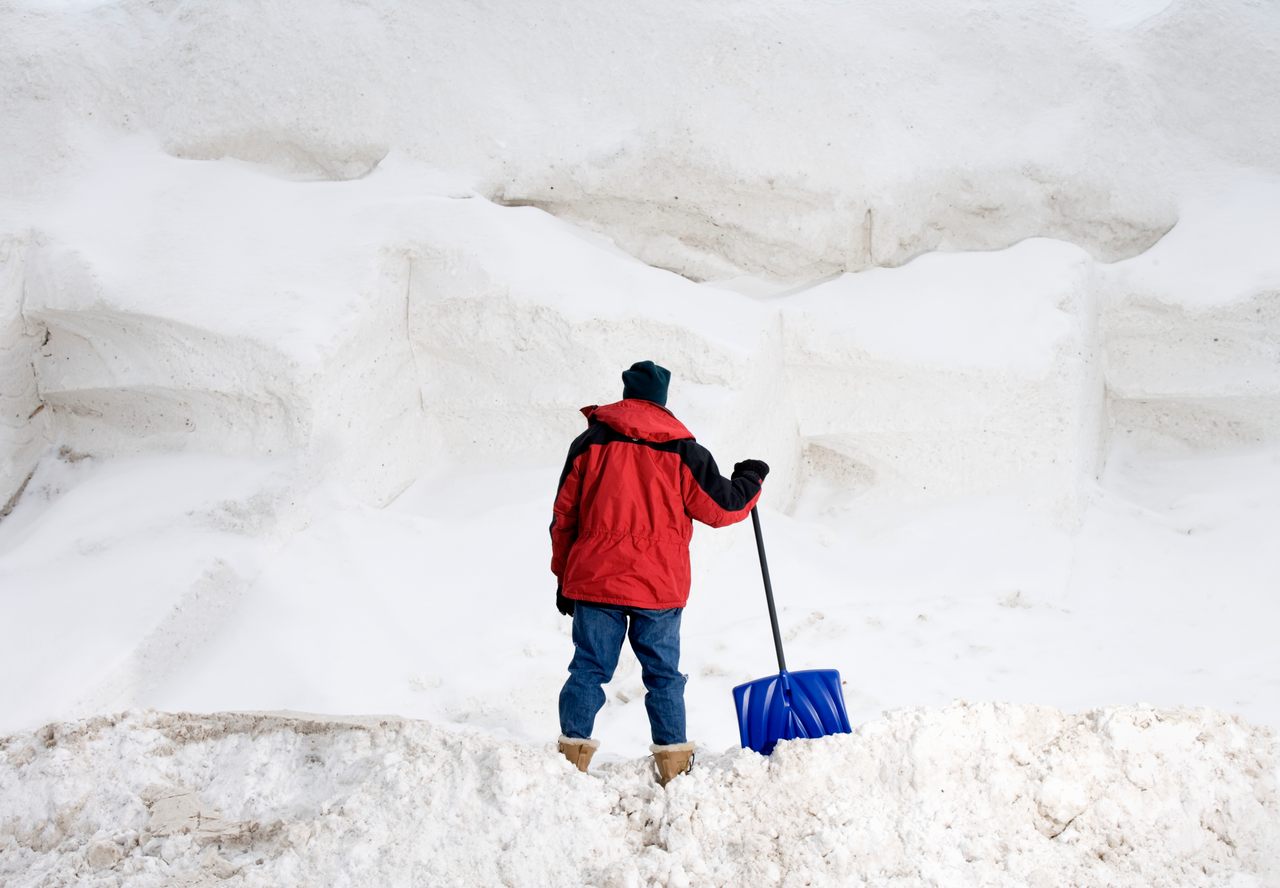
Impressive numbers, for sure, but assuming you have a measuring stick long enough to reach the ground beneath all the white, how hard can it be to measure? You stick a ruler or yardstick into the snow and get a number, right? Well, not so fast. It’s a little more complicated than you might think to get those oh-so-important snow totals for winter storms.
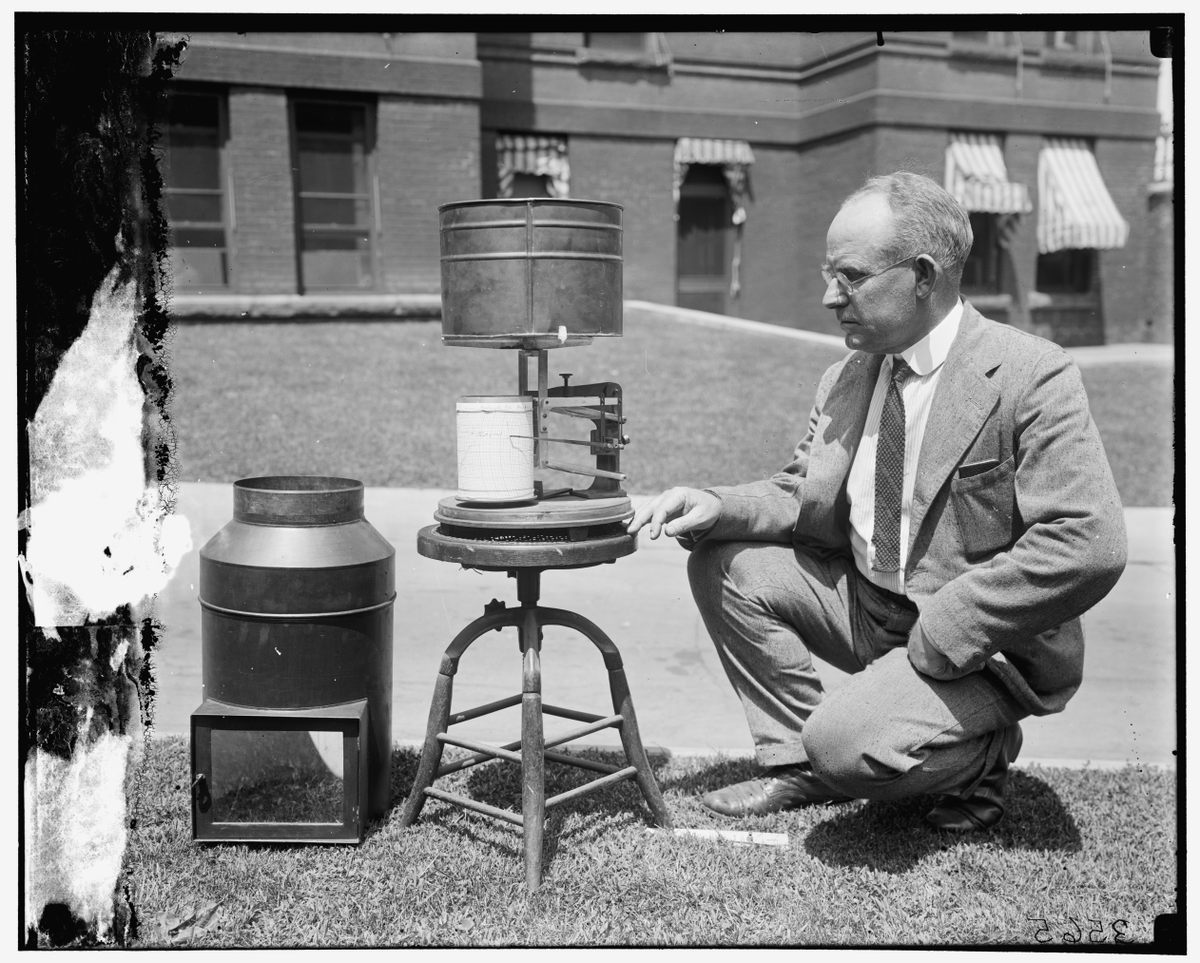
Since 1890, the United States National Weather Service has relied on a network of volunteer observers, all strictly adhering to the NWS guidelines, to come up with snow measurement numbers over a region. There are over 8,700 cooperative observers across the country who send in their weather data to the NWS daily, some who have done it for over 75 years!
Snow measurement is inherently inexact, but attending to one’s surroundings and sticking to the guidelines help those of us who do it on a regular basis stay consistent—and with long-term weather records, consistency is arguably just as important as accuracy.
First, you need to understand the difference between snow depth and snowfall. Snow depth should be a measure of the average depth in a given location and its immediate surroundings. It’s usually rounded to the nearest whole number. To get a representative number, you need a site with minimal drifting (not always easy to find), and several measurements should be averaged to get a final number. I like 10 because it makes the math easy.

Careful measurement is vital in order to make reasonable estimates for the amount of liquid contained in the snowpack. As hard as it is to believe at times, the snow will eventually melt, and rapid melting could cause problems with flooding. Also, hydrologists’ models that are used to predict water levels critically depend upon good initial data collection, though improved satellite data has helped reduce their reliance on any individual measurement.
Snow depth is like the sum of individual snowfalls, if one assumes no sublimation—snow turning into water vapor—or melting from the first snowfall until now. That assumption would almost always be wrong, of course. But if you suspend reality for a moment, the depth will still never exceed the sum of all snowfalls because snow is compressible. So, two 10.5-inch (27-centimeter) snowfalls may accumulate to a depth of only 17 inches (43 cm).
It’s the compressibility of snow that causes the greatest consternation with snowfall measurement. Snowfall is the amount of snow that accumulates during a given time, usually a 24-hour period. In a perfect world, this 24-hour period would end at midnight, but the vast majority of National Weather Service cooperative observers take their daily observation in the morning.
To properly measure snowfall, you need a flat, level surface. As with snow depth, you want to avoid areas of drifting when you’re measuring snowfall. The National Weather Service suggests the use of a snow board, which is a white surface that will absorb very little sunlight and stay close to the ambient air temperature. Any cold surface will do, though. Keeping in mind that consistency is critical, the goal here is to make an accurate measurement that is representative of the surrounding area and consistent with others making snowfall measurements.

So, let’s consider three common scenarios. Here in the eastern U.S., we often have to deal with snow that changes to rain during the course of a storm. Imagine 6.0 inches (15 cm) of snow falls, then an inch (2.5 cm) of sleet which compacts the snow to a 4-inch (10-cm) depth. Then, on top of that falls an inch of freezing rain which further compacts the snow to 2.6-inch (6.6-cm) depth by the end of the observation period. What should be listed as the daily snowfall? The snow depth?
In this situation, when the snow transitions to sleet, the snow board should be cleared and the maximum depth of snow recorded—6 inches (15 cm) in this case. Do the same with the sleet and this will add an inch (2.5 cm) to the snowfall—technically, “solid precipitation”—total. Freezing rain is never added to the daily snowfall total because it is in liquid form when it reaches the ground. Thus, the daily snowfall is 7.0 inches (measured to the nearest tenth of an inch) (17.8 cm), while the snow depth at observation is rounded up from 2.6 inches (6.6 cm) to 3 inches (7.6 cm).
Imagine a case where three heavy snow showers occur one afternoon, two dumping 1.5 inches (3.8 cm) before melting completely and then a third 1.8-inch (4.6-cm) event. The daily snowfall would be reported as the greatest depth achieved during that period, 1.8 inches (4.6 cm). This assumes an observer is there to measure each short-lived accumulation. But because most observers are volunteers, that’s not always the case, unfortunately.
Finally, we come to the controversy. Let’s assume a steady snow falls for the entire 24-hour period at a rate of 2.0 inches (5.1 cm) per hour. If the snow board were cleared every hour, the daily snowfall would be 48.0 inches (122 cm).
But what if the observer could be there only at the daily observation time? By then the snow will have compacted some, depending upon the temperature and the amount of liquid in the snow, which can vary between about a quarter-inch and 3 inches (0.6 - 7.6 cm) of liquid water for every 10 inches (25 cm) of snow. That liquid-to-solid ratio depends upon many factors, including the temperature within the cloud where the snow was produced, which in turn helps determine how large the snowflakes can get. Large, airy snowflakes produce less-dense snow and lower liquid-to-solid ratios, in general.
This once-a-day observer would log significantly less snowfall for the exact same event than the person who cleared the board every hour. This is a problem. The National Weather Service addresses it by mandating that no more than four snowfall measurements should be made in any 24-hour period. Ideally, then, an observer who went to the snowboard every six hours and cleared 10.5 inches (26 cm), 9.3 inches (23.5 cm), 11.5 inches (29 cm) and 10.8 inches (27 cm) would get the officially correct snowfall measurement of 42.1 inches (107 cm).
Several years ago, an observer in New York measured 77.0 inches (196 cm) of snow in a 24-hour period, which would have broken the record for heaviest one-day snowfall in U.S. history. However, the National Weather Service determined that he cleared the snowboard much too frequently, thus inflating the daily total and invalidating the record.
Intrigue, suspense, mystery, controversy. So much more than just sticking a ruler in the snow. If it all sounds like a daily dose of meteorological fun to you, maybe you’ve got what it takes to volunteer for the NWS’ Cooperative Observer program, where it’s not all about the white stuff. Daily high and low temperatures and precipitation of all forms are also measured, to strict NWS standards, of course.
For those who want to stick with measuring only what falls from the sky, check out the Community Collaborative Rain, Hail and Snow Network. Anyone may join, but those who live “in the middle of nowhere” can provide an invaluable service by helping fill gaps in the data that limit the effectiveness of hydrological models.
Bill Syrett is an associate teaching professor of meteorology and atmospheric science, and manager of the Joel N. Myers Weather Center, at Penn State. This is an updated version of an article originally published on Feb. 19, 2015.


Follow us on Twitter to get the latest on the world's hidden wonders.
Like us on Facebook to get the latest on the world's hidden wonders.
Follow us on Twitter Like us on Facebook