How to See Lava Most Clearly
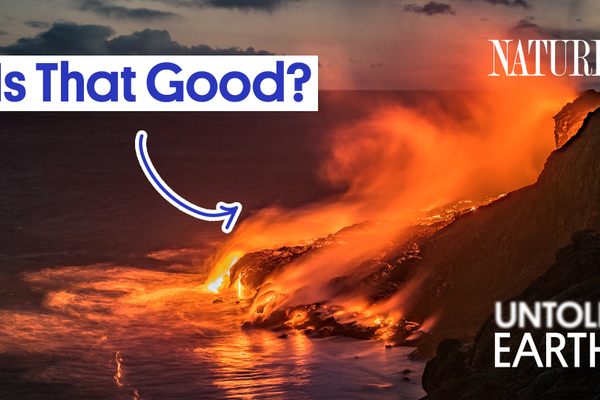
You’d think it would be simple enough to see bright-red molten rock.
You’d think it wouldn’t be hard to see lava: If there’s a red hot stream of molten rock in the vicinity, you’d definitely know, right? But one of the best ways to visualize lava flows is by capturing their heat, using thermal imaging cameras.
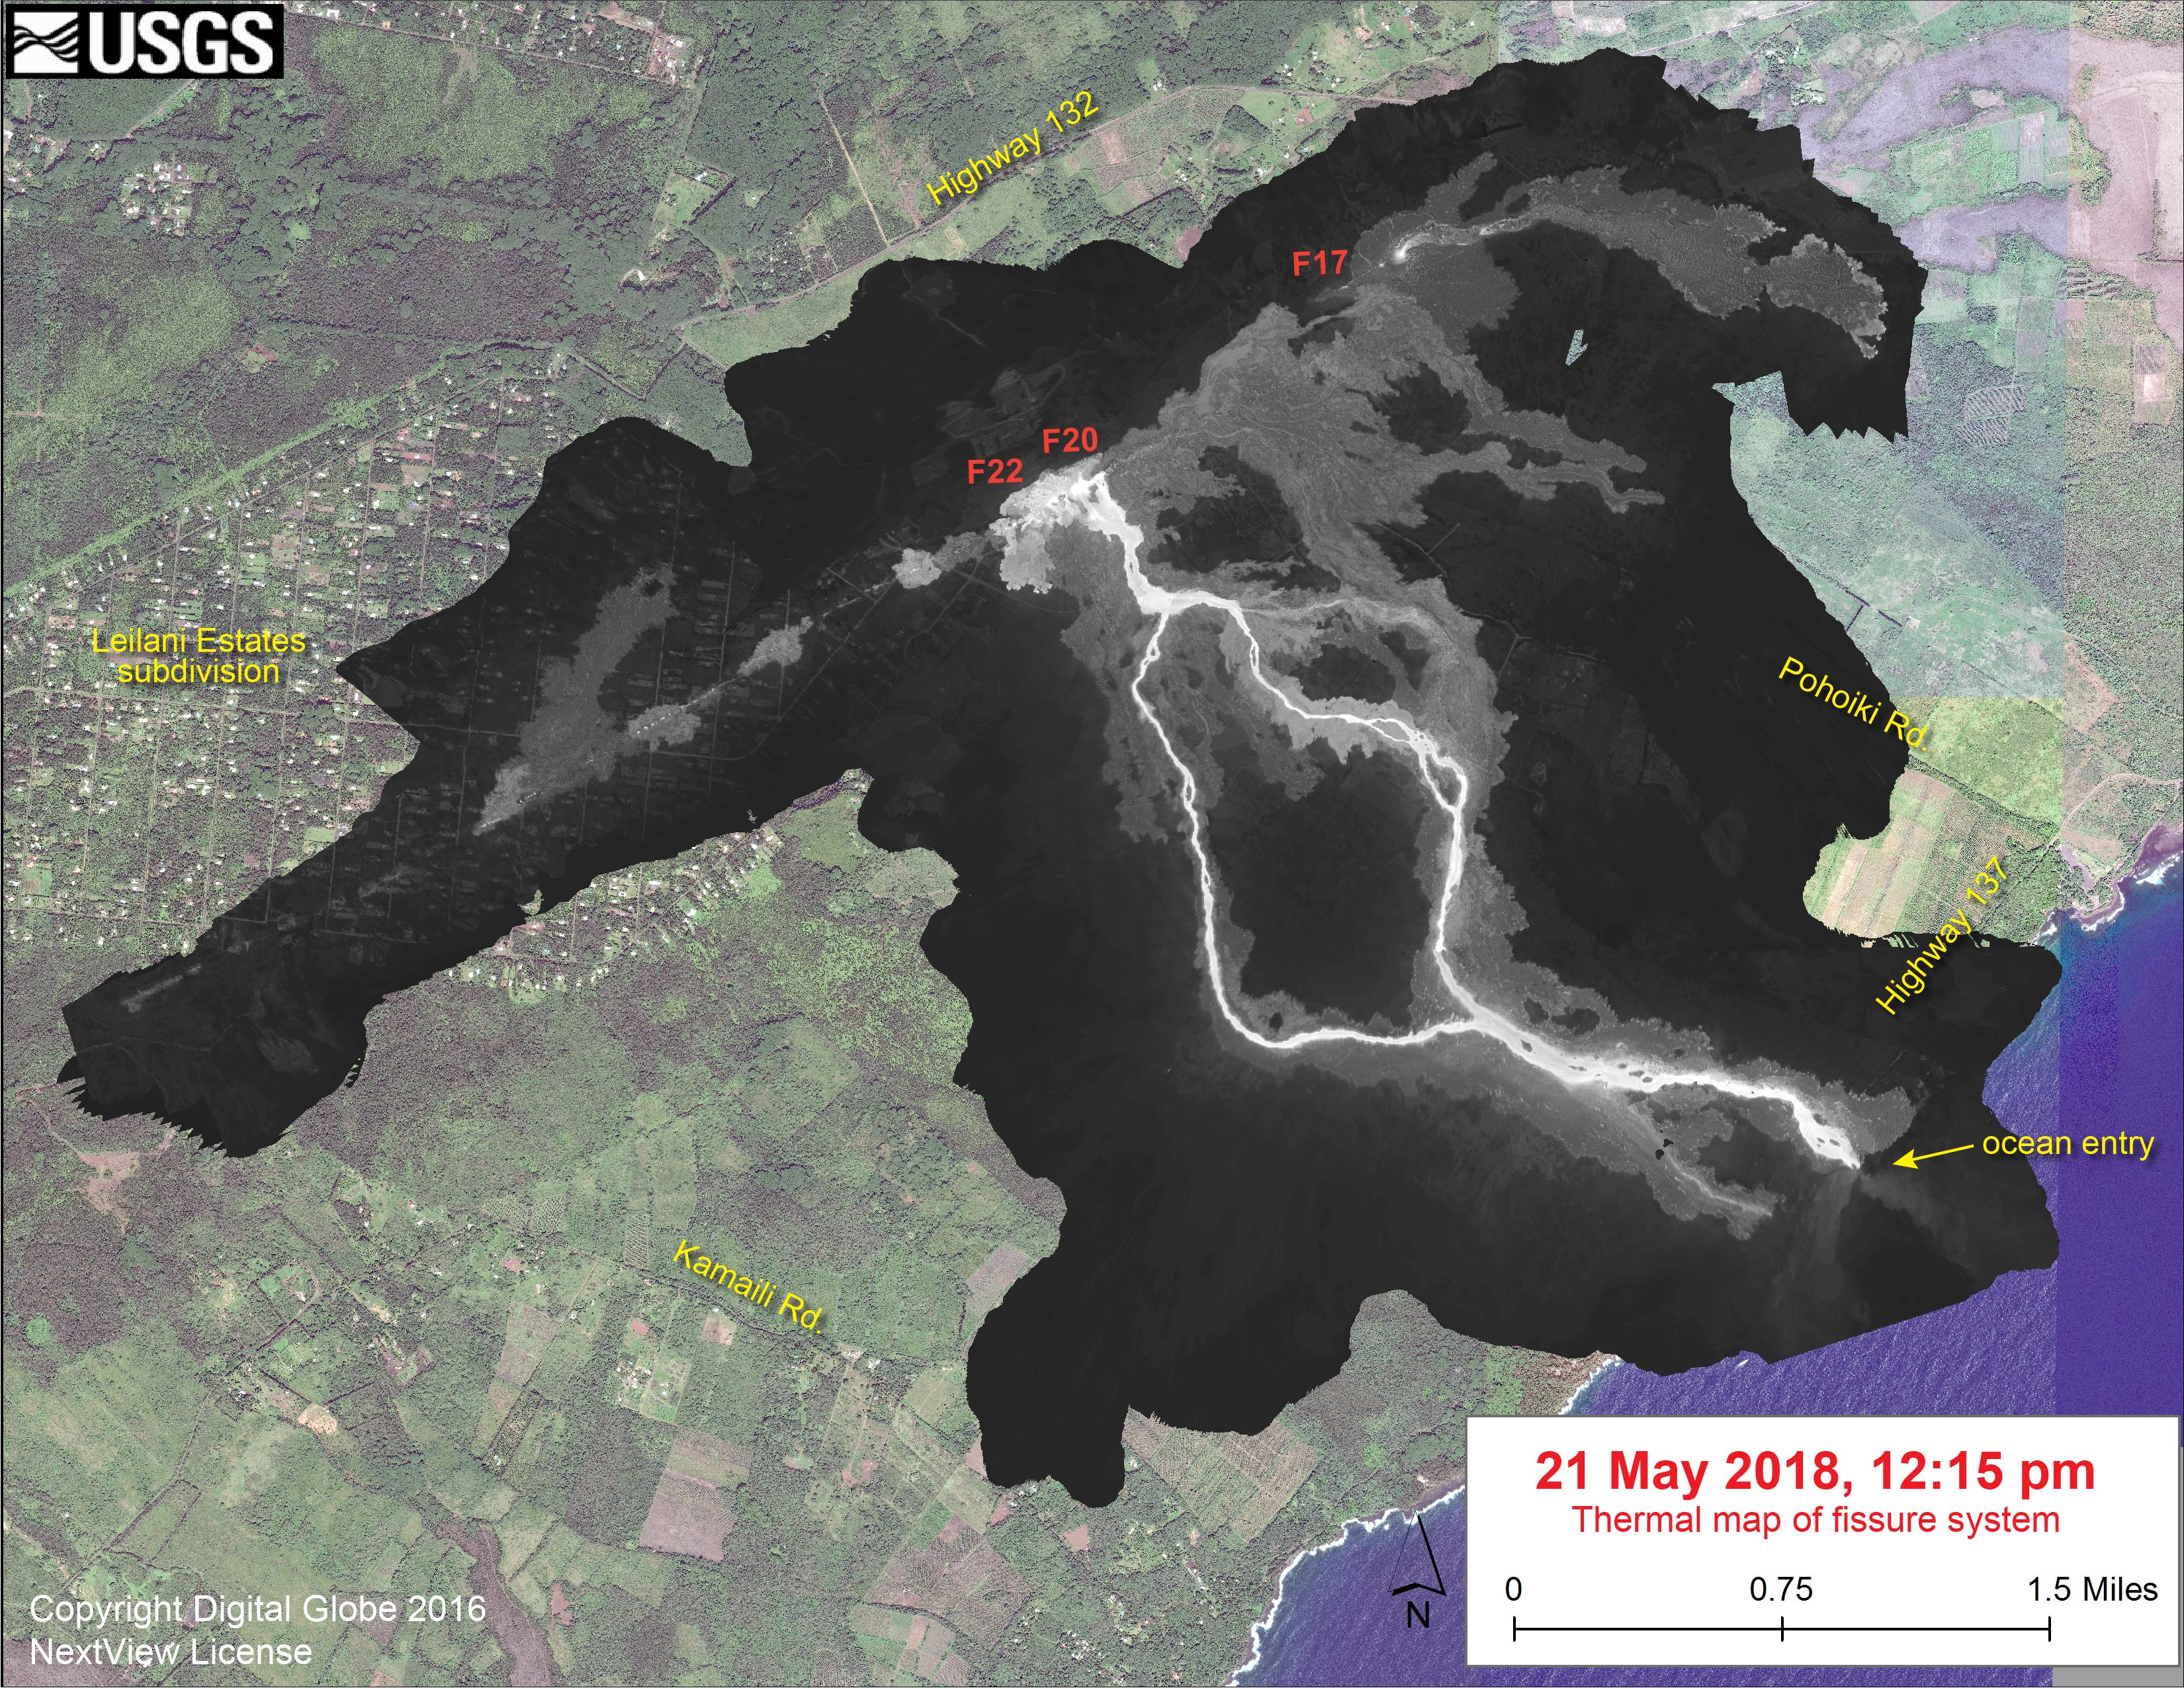
In the image above, the United States Geological Survey has mapped the fissure systems and lava flows of the eruption at Kīlauea in Hawaii, by flying over the area with handheld thermal cameras and knitting the images together into one map. The brightest areas—the white lines—represent the hottest parts of the lava field.
Sometimes, lava flows actually can be hard to track visually, if they sneak down into cracks or, for smaller flows, are shielded by forest cover. Thermal imaging can reveal volcanic activity under these conditions, and even help monitor lava conditions under the ground, before an eruption. The Hawaiian Volcano Observatory also uses thermal images gathered by satellites to track volcanic activity during periods when there’s not a destructive lava flow coursing across the land.
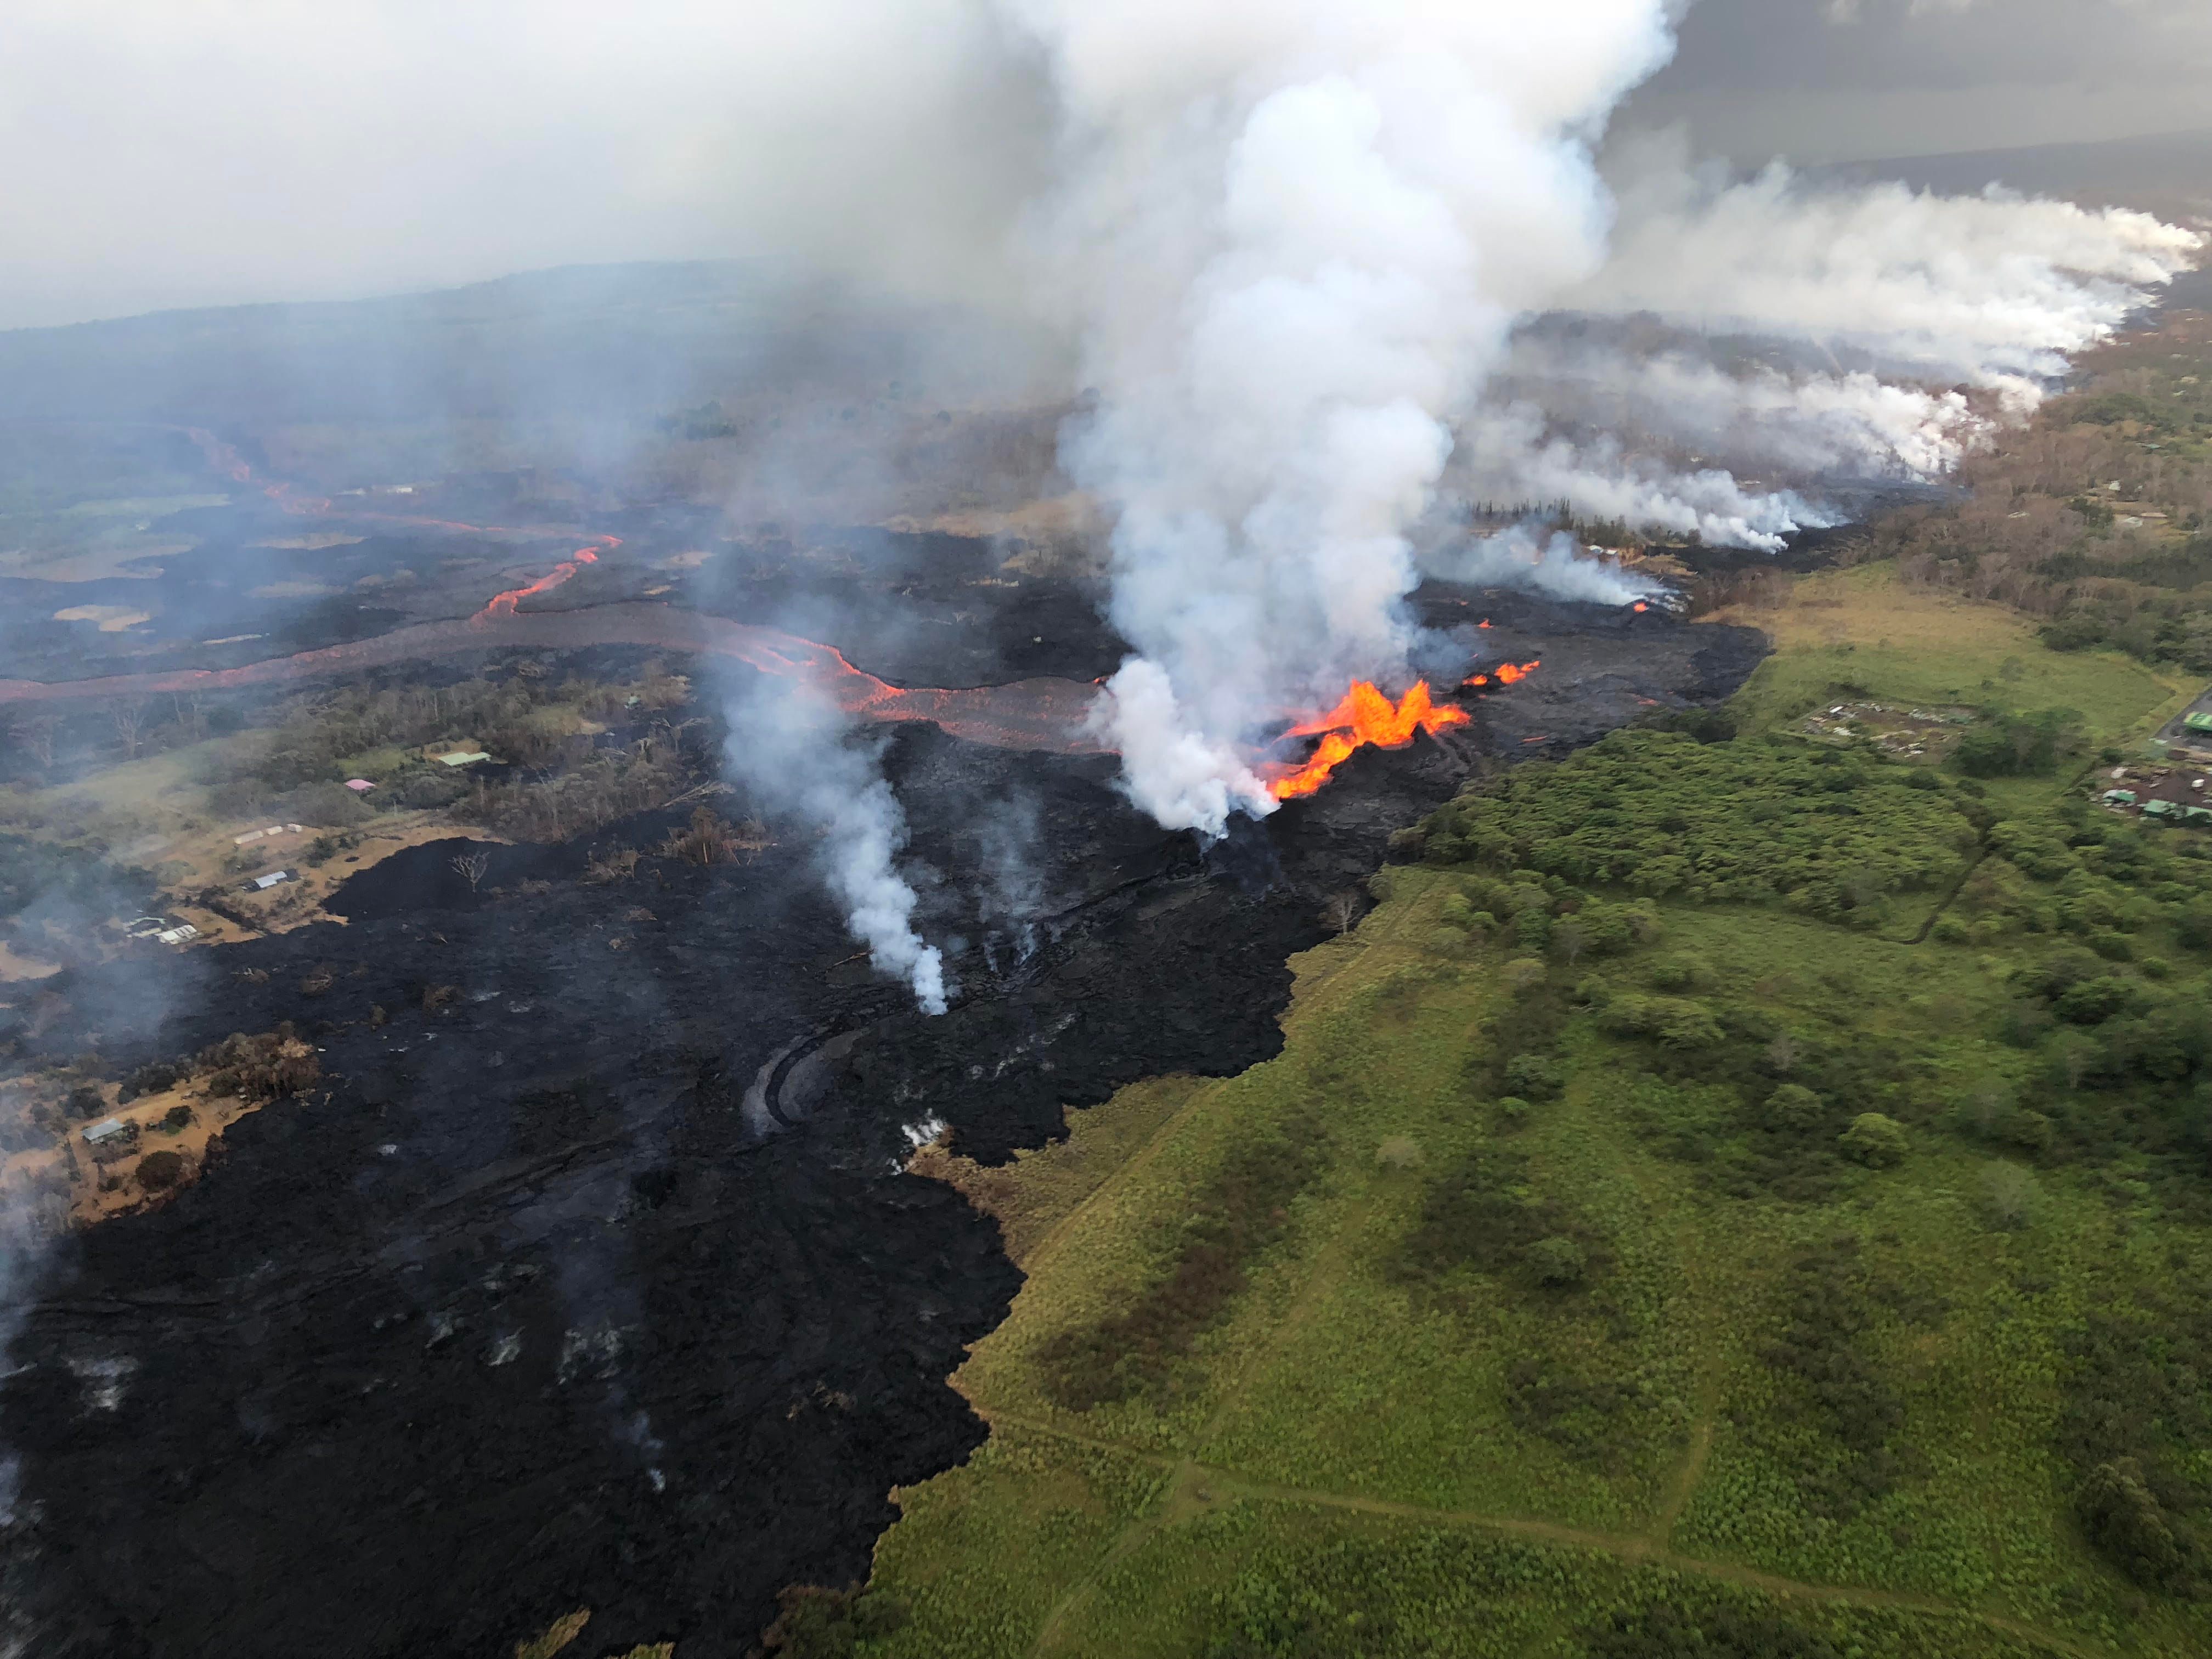
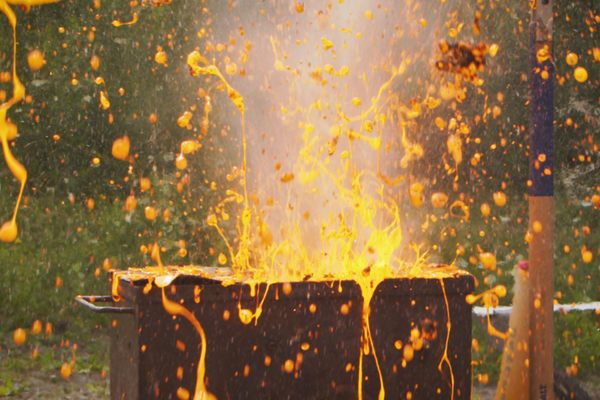
As the USGS notes, as of May 21, 2018, when this image was captured, the primary lava flows were coming from the area between Fissure 20 and 22 (F20 and F22 on the map). But what the thermal cameras don’t capture is how dramatic that can flow is up close. Here are some additional photos the USGS captured at fissure 22.


Follow us on Twitter to get the latest on the world's hidden wonders.
Like us on Facebook to get the latest on the world's hidden wonders.
Follow us on Twitter Like us on Facebook