The Fantasy Maps That Put the World’s Tallest Mountains Side by Side
In the 19th century, the romance of mountains met the desire to quantify the natural world.
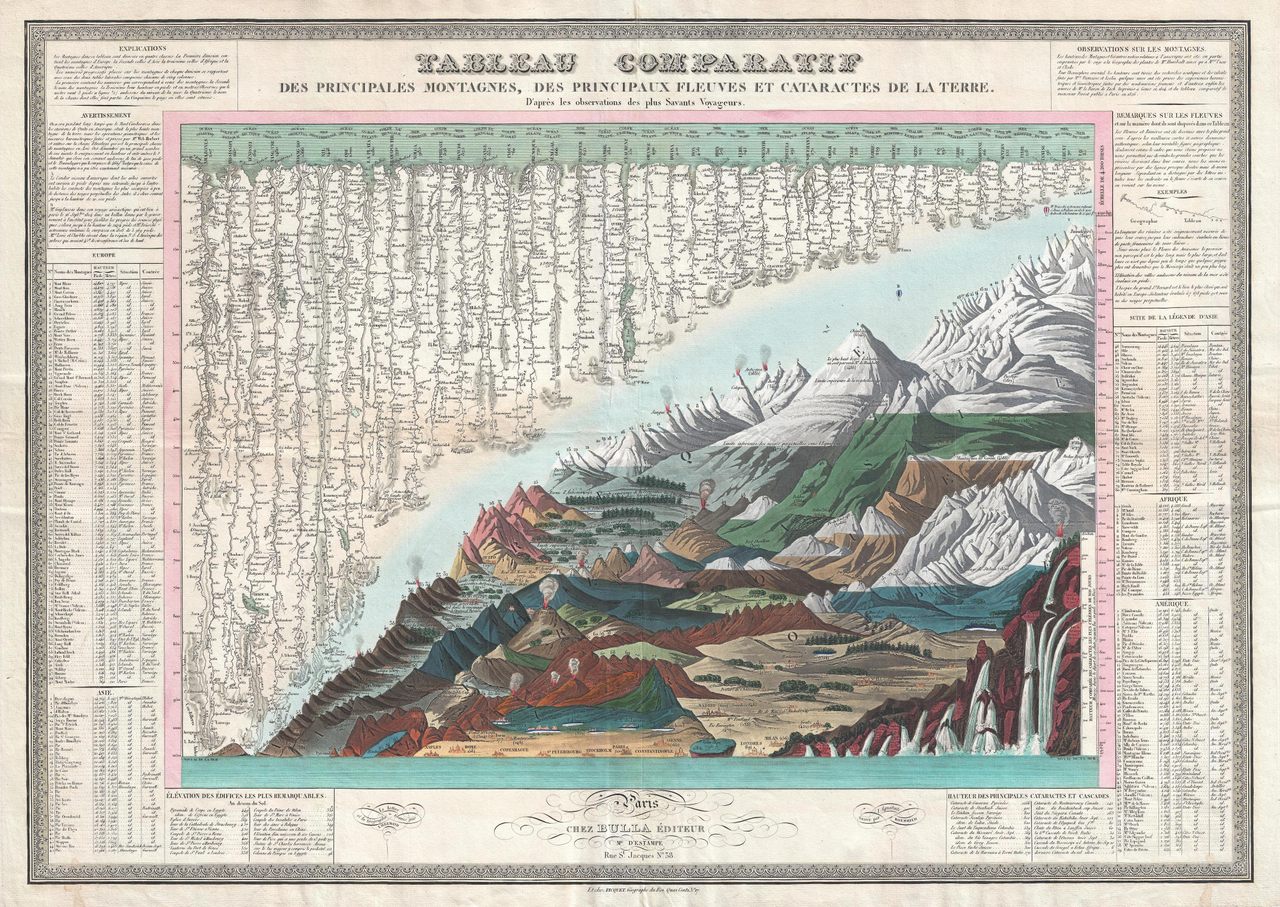
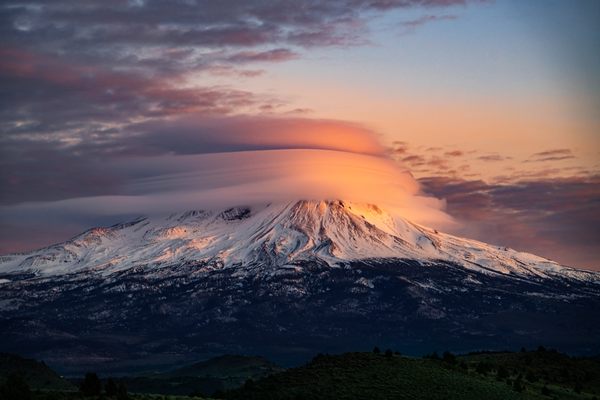
The cooled lava, ash, and pumice of the Cotopaxi volcano climb to more than 19,300 feet. The volcano, part of the Pacific Ring of Fire, is near Quito, Ecuador—clear across the globe from 26,800-foot Dhaulagiri and its dozens of Himalayan cousins in India, Nepal, and Bhutan. But if you had only J. Andriveau-Goujon’s atlas from 1829 to go by, you’d be forgiven for thinking otherwise. On a single plate, Cotopaxi and its billows of gray smoke sit right below Dhaulagiri’s snow-capped summit. This image, and many others like it, cast longitude and latitude to the wind. On it, altitude is king.
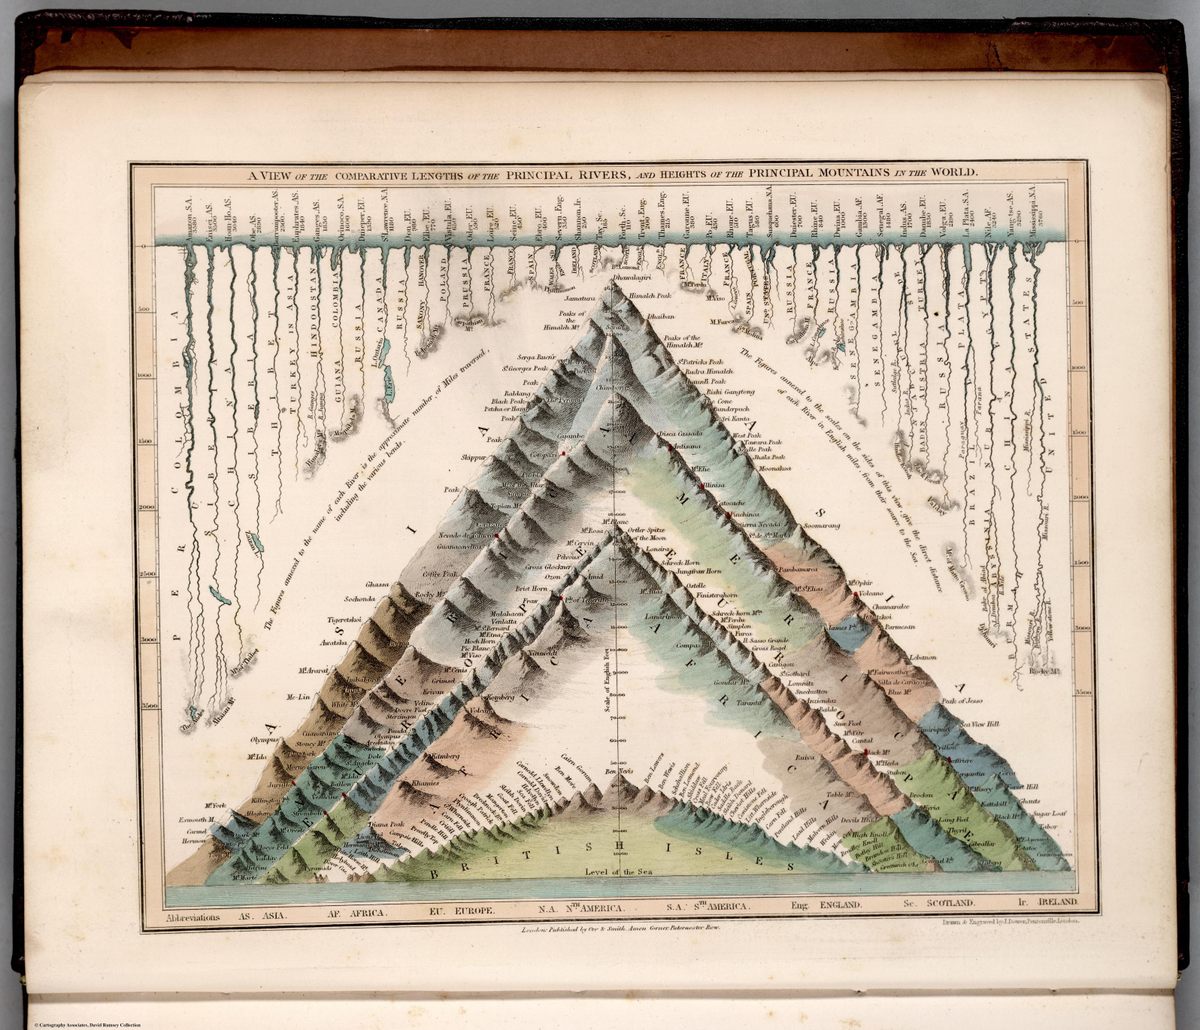
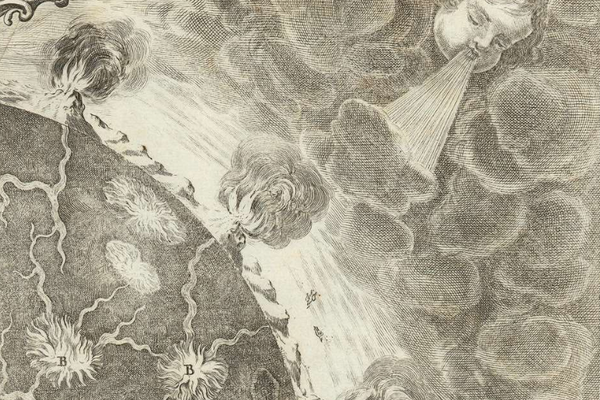
In the 19th century, cartographers had a penchant for plotting some of the world’s tallest peaks together on single charts. The results were imaginary landscapes; some placed all of the world’s mountains into a single, massive range, while others evoke cross-sections, with the mountains stacked inside one other like geological nesting dolls.
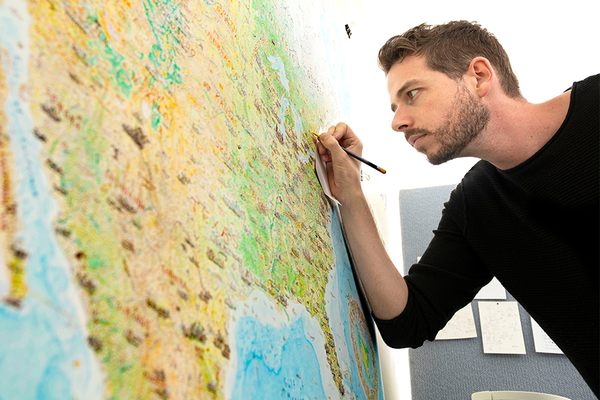
Matthew Edney, a geographer at the University of Southern Maine, attributes the style’s popularity to a few factors—particularly poets swooning over the natural world, and the dash to measure and document it.
Thanks in part to the Romantic writers, mountains were shifting in the 19th-century cultural imagination, from places to be avoided to landscapes calling out to be traversed, even if they remained sources of fear. William Wordsworth was a bard of slopes and summits. He traipsed through the Alps, and in The Prelude, described scaling Snowdon, in Wales, through thick clouds:
I found myself of a huge sea of mist,
Which, meek and silent, rested at my feet:
A hundred hills their dusky backs upheaved
Meanwhile, scientists were doubling down on Humboldtian science, named for Alexander von Humboldt, a German naturalist who liked mountains and never met something he didn’t want to quantify. His principles involved “going out and measuring everything you can about the natural world, and then from there figuring out some rules of nature,” Edney says. Humboldt proposed spatial dynamics to natural laws—noting, for instance, that altitude, not just distance from the poles, affects the distribution of plants. In the Andes, he documented that the plants growing at various heights roughly matched the bands of plant life you’d encounter if you marched north from the equator. “This just blew everybody away,” Edney says.
Among the earliest visual comparisons of the world’s mountains is one engraved in 1817 by the Scottish firm W. and D. Lizars, for the new edition of Thomson’s New General Atlas. In it, the peaks are clustered by hemisphere. “That Lizars was directly influenced by Humboldt’s work is evidenced by the presence of Humboldt himself, a duly noted speck on the left-hand face of Chimborazo,” writes Kevin Brown of Geographicus Rare Antique Maps, a dealer that sells some of these charts.
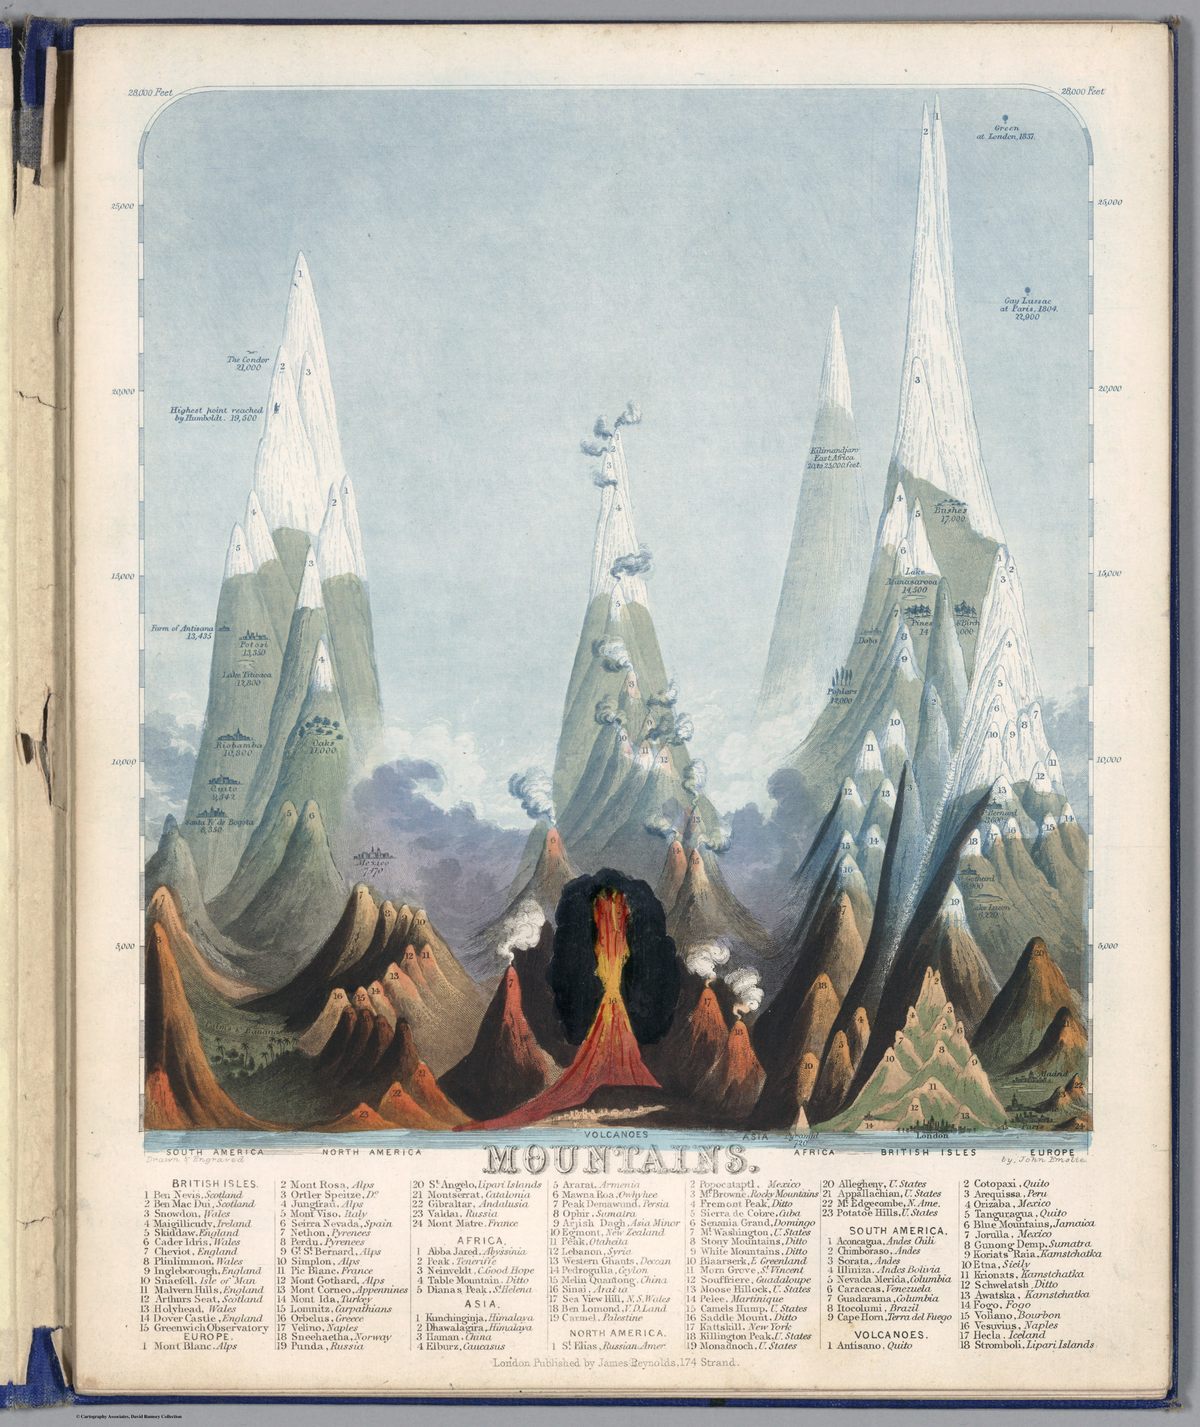
Tiny annotations are scattered across many of these diagrams. Squint at an 1823 one by William Darton, and you’ll see notes about the maximum elevations of banana trees and lichens, as well as the elevation of snow line, the line below which snowcaps don’t persist. (Near the equator, Darton noted, this boundary is roughly 15,000 feet above sea level.)
These charts also reward close scrutiny with Easter eggs. Find the 23,000-foot mark on some of the charts to spy a tiny hot air balloon that represents the height of French chemist Louis Joseph Gay-Lussac’s 1804 ascent. Andriveau-Goujon’s 1829 version includes the silhouette of a condor soaring to 6,500 feet—the height of the Chimborazo volcano in the Andes. Other cartographers included mines and cities. Near the bottom of Darton chart, which ends at sea level, you’ll find Rome and a couple of pyramids. Alongside mountains, some of these plates also ranked waterfalls or the world’s longest rivers.

While these sprung from a desire to record and quantify everything in sight, they weren’t necessarily intended for the people doing the measuring. The landscapes would have been printed in atlases intended for a curious layperson’s library, Edney says. “Hardcore scientists would be using much more detailed tables and lists.”
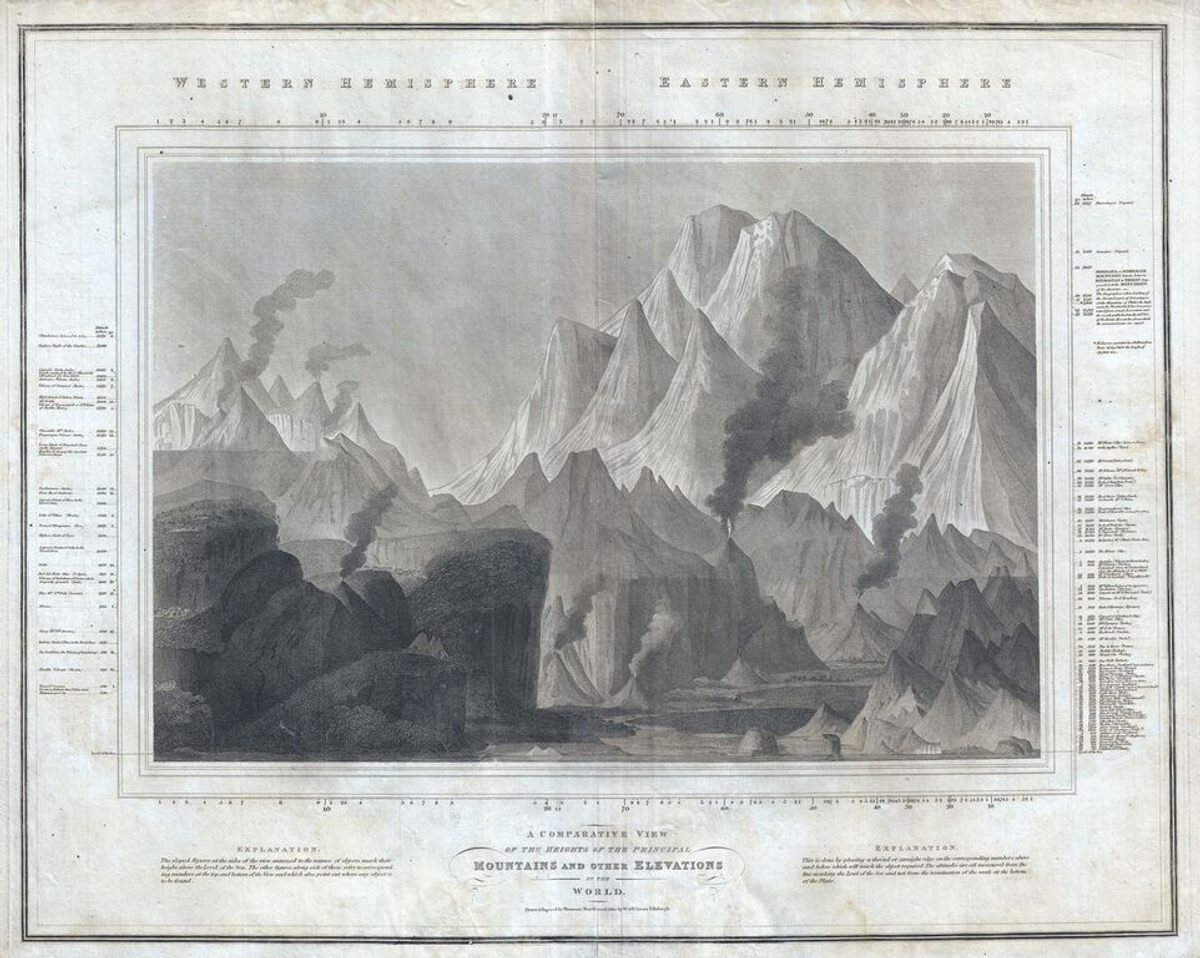
Despite the annotations, these charts weren’t entirely reliable. Cartographers had to leave some things out to make them hang together. Though mountains come in various shapes—steeply sloped, jagged, or gently rolling to a plateau—many of the charts depict most mountains the exact same way, often as a tepee shape or a sharp, snowcapped peak. Edney suspects that this was less an aesthetic choice than a product of a still-murky understanding of what mountains are, beneath the summits. (Unless a mountain rises above a relatively flat plain, as Fuji and Vesuvius d0, you might only glimpse a fraction of it at a time.)
Production of these comparative charts petered out by the middle of the century. Edney’s not quite sure why. Today they’re pretty but outdated—and the rankings are moot, because many of the most highest peaks, such as Everest, hadn’t even been surveyed yet. The charts are relics of an era when cartographers were infatuated with measurements and comparisons, and drew weird, wondrous worlds in the process.


Follow us on Twitter to get the latest on the world's hidden wonders.
Like us on Facebook to get the latest on the world's hidden wonders.
Follow us on Twitter Like us on Facebook