What Footage From 1980s Bike Races Can Teach Us About Climate Change
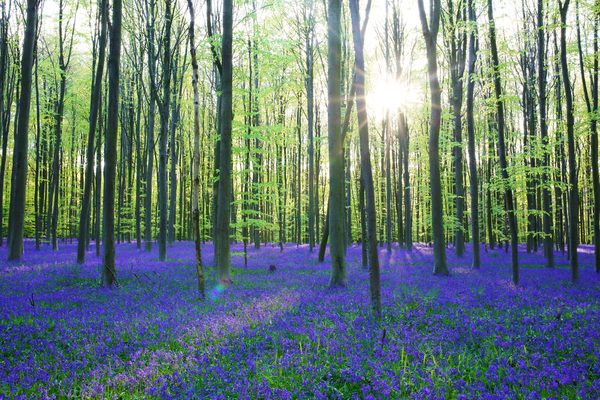
Ignore the Lycra—look at the flowers.
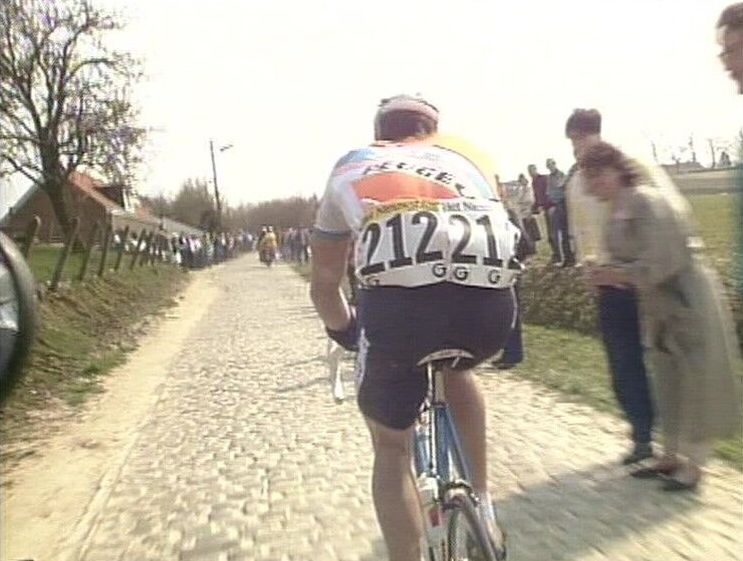
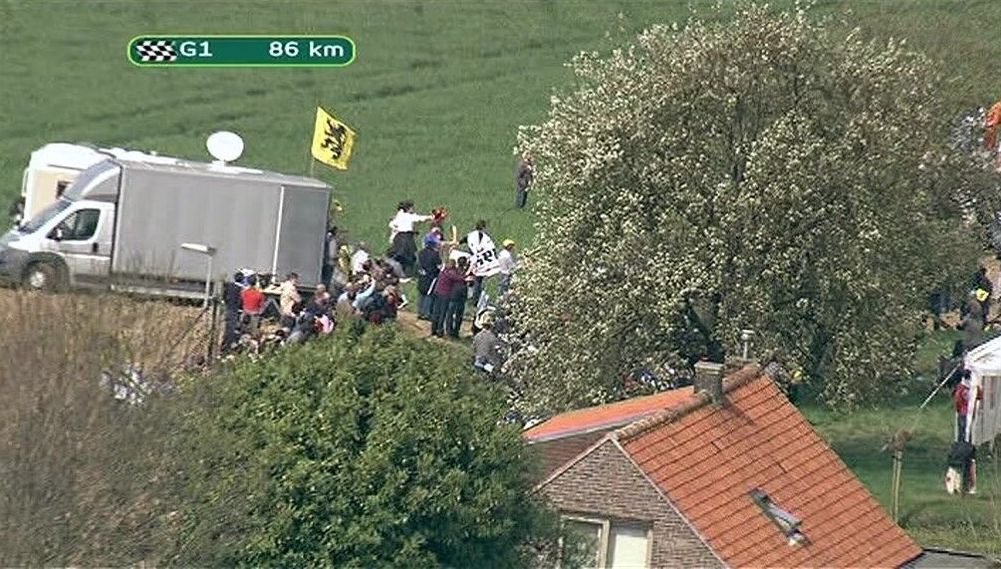
On April 5, 1981, the Dutch cyclist Hennie Kuiper won the Tour of Flanders by a full minute. His compatriots Frits Pirard and Jan Raas came in second and third. Odds are, as the three were pedaling towards the finish line, they didn’t notice whether the trees they were whizzing by had bloomed or not.
Decades later, though, another group decided to go back and take note. In a recent paper in Methods in Ecology and Evolution, a team of researchers describes how they used old footage from the Tour of Flanders to study a different kind of cycling: the plant life cycle. Figuring out exactly when trees leaf and bloom can help us understand what motivates them to do so, and how climate change affects that timing.
The study of plant and animal life cycles is called phenology. Keeping track of this in real time is laborious but straightforward: “People go out in nature and simply write down the date when the plants produce their leaves or flowers,” explains Pieter De Frenne, a bioscience engineer at Ghent University and the lead author of the Tour of Flanders paper.
But if you’re trying to get this data for past time periods, it’s necessary to get more creative. In recent years, researchers have pieced together phenology data from herbarium specimens, an 18th-century book of grapevine illustrations, and the journals of Aldo Leopold and Henry David Thoreau.
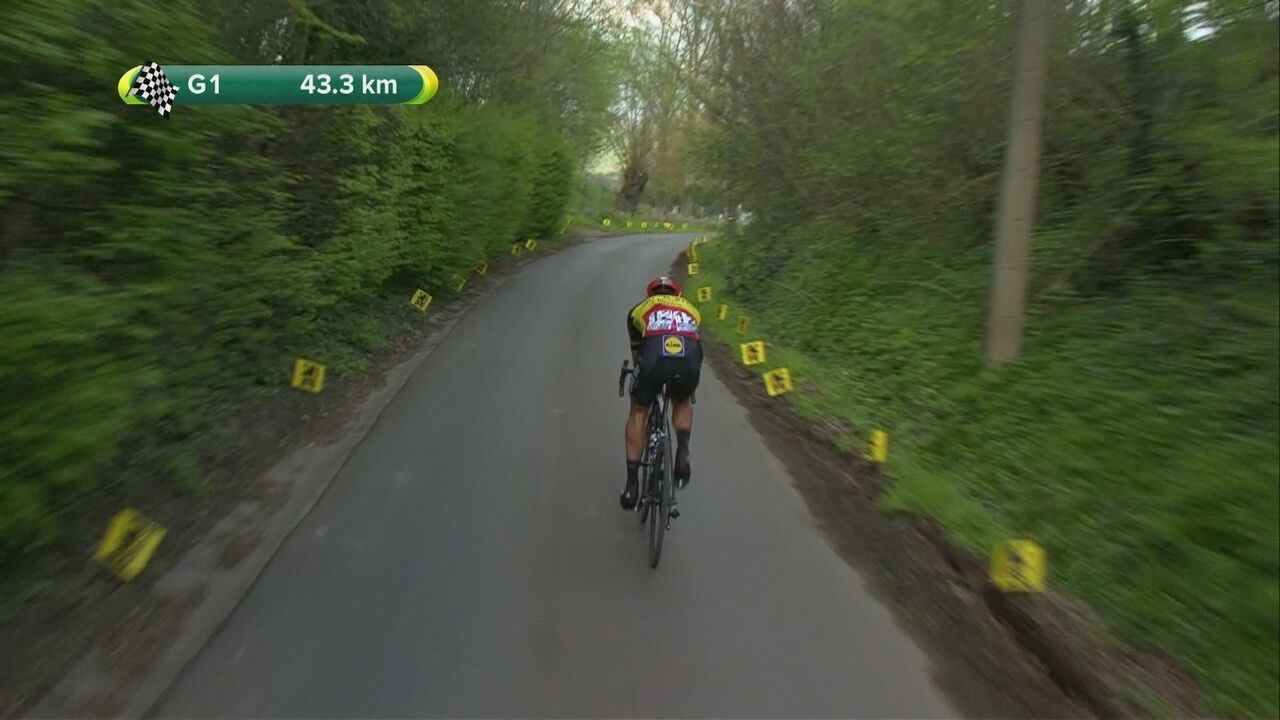
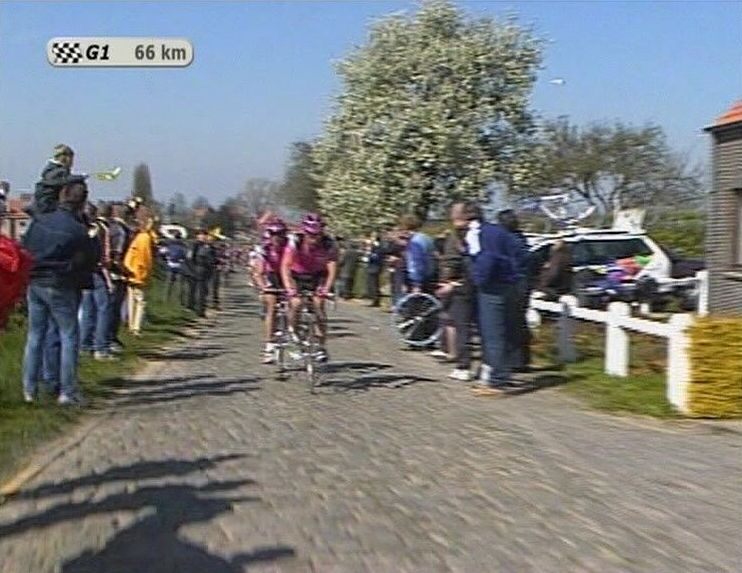
De Frenne and his coauthors came to their own method naturally. “We’re cycling fans,” De Frenne explains. “When the big spring races are coming up, many television stations show archived video footage from the same races.” They noticed that while the course stayed the same, the scenery changed: In the older races, the bikers pedal past bare trees and flowerless bushes. “In more recent editions, the landscape is green,” he says. “[Spectators] are wearing shorts and t-shirts.”
It struck them that bike race footage could be a great tool for phenology. For one thing, many of the races happen in the spring, when all the bloomin’ action is. They also tend to cover the same ground: the Tour of Flanders, for example, has had a fairly consistent route, and is generally held the first weekend in April.
Finally, “they are very popular,” De Frenne says. “They are broadcast around the world by television stations. So this means there is high potential that some of these stations will have archived the footage.” (The Tour of Flanders tape, which was held at the VRT archives in Brussels, clocked in at 200 hours—all of which was viewed by another of the paper’s authors, Lisa Van Langenhove.)
They decided to figure out a way to quantify this change. First, the researchers identified 46 individual trees and shrubs that made cameos in different races between 1981 and 2016. Then they came up with a scoring system. “We quantified the percentage of leaves and the percentage of flowers that were present on the tree at the time of the race,” says De Frenne.
“We then gave them a score between zero and four, with zero meaning no leaves visible, and four meaning all leaves visible.” They compared these scores over time, in order to pinpoint how much earlier each plant was getting in the game.
They found “surprisingly strong shifts,” says De Frenne. Although it depended somewhat on the species in question, plants were 67 percent more likely to have flowered before race-time in 2016 than in 1981, and 19 percent more likely to have leafed. Using weather data, the researchers were also able to connect higher winter temperatures with earlier flowering and leafout.
De Frenne thinks the footage holds even more potential. It contains plenty of landscape features we could use a long view on, from lakes and rivers (what’s the water level?) to fields full of crops (when did they get planted, and when did they sprout?).
And other recordings could provide similar insights, the authors add, including “news items, sport events, demonstrations or pop concerts.” As we’ve taken care to film our own small dramas, a larger one has been playing out in the background; you just have to know where to look.


Follow us on Twitter to get the latest on the world's hidden wonders.
Like us on Facebook to get the latest on the world's hidden wonders.
Follow us on Twitter Like us on Facebook